Although ALight Technology And Services Limited is a very small startup as of now but internally there are few different servers hosted on AWS. I had the need for a private DNS server. This blog post is about setting up a Private Hosted Zone in Route 53 on AWS.
*Hosted Zones cost $0.5 per month and additional for the DNS queries but worth instead of going through the trouble of setting up own DNS servers on few different EC2 instances (alternate and slightly cheaper way, but not very reliable and lots of sysadmin work).
Here are the steps:
Go to Route 53 and create a new Hosted Zone with the Type – Private Hosted Zone option.
Associate the necessary VPC’s, be careful not to have overlapping addresses. The VPV’s need to have DNS Hostnames and DNS Resolution enabled.
Now log in into your EC2 instance and do a nslookup.
> nslookup my.local //Assuming you have setup a record as my.local in Route 53.
For me the 4th part solved my error – Review custom settings in resolv.conf.
Hoping the above blog post helps someone.
Although, I have AWS Certified Architect Certificate and do have knowledge of AWS Route 53 Private Hosted Zone, this effort has allowed me to gain hands-on experience!
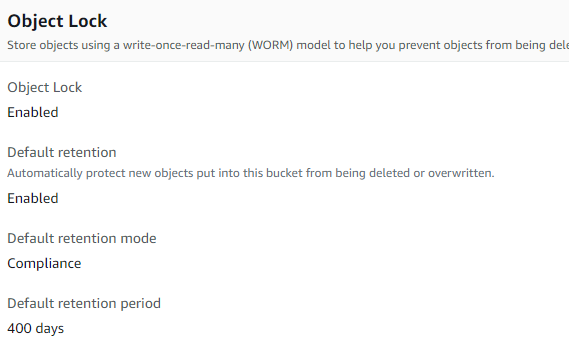
I have created a bucket in S3 with the following retention policies:
AWS S3 Object Lock Policy
I personally don’t have to follow compliance yet, but nothing wrong in implementing compliance policies.
I have also defined a life-cycle policy to transition objects into Standard-IA (Infrequent Access) after 30 days.
Now I am developing a Lambda that would create Export tasks in CloudWatch once a week.
Here are some relevant C# code snippets:
var _client = new AmazonCloudWatchLogsClient(RegionEndpoint.EUWest2);
// Initialized AmazonCloudWatchLogsClient

var response = await _client.DescribeLogGroupsAsync();
// Get a list of LogGroups

foreach(var logGroup in response.LogGroups)
{
    var prefix = $"{from}-{to}-{logGroup.LogGroupName}";
    // You can define your own prefix

    var exportResult = await _client.CreateExportTaskAsync(new
        CreateExportTaskRequest
{
            Destination = "<NAME_OF_S3_BUCKET>",
            DestinationPrefix = prefix,
            From = GetUnixMilliSeconds(from),
            LogGroupName = logGroup.LogGroupName,
            TaskName = prefix,
            To = GetUnixMilliSeconds(to),
        })
    };
The above code is pretty much self-explantory. Here is a code snippet for getting Unix MilliSeconds from epoch.
long GetUnixMilliSeconds(DateTime dateTime)
{
    var _epoch = new DateTime(1970, 1, 1, 0, 0, 0, 0);
    return (dateTime.Ticks - _epoch.Ticks) / 10000;
}
I had a need to generate random passwords and / keys and update various config files. For example, keys and passwords used by log ingesting utilities such as FileBeat, PromTail, MetricBeat etc…
In earlier blog posts, I have mentioned, that at this point log ingestion, retention and major alerts implementation is complete. So, obviously the next part is securing the keys.
I know the hacker spies – India’s psychopath R&AW spies can and are seeing any plain-text items on screen and if I am not wrong, they might have even hacked into my accounts several times. Yes, they say they are investigation teams etc… bull-shit but in reality they are corrupted and are the criminals i.e greedy investigators / spies who did crime and are trying to get away from crime.
Anyway, because I know how the “prying eyes” equipment works, I need to defend myself from the hacker spies as much as possible. For more info about this scam: https://www.simplepro.site.
Here is a small C# code snippet for reading from console without echoing back:
Now everyone knows how to do open a file, read content and replace content. A simple program can be developed that would take the path of config file, old value, new value and replace.
i.e for example during test, alpha modes if a key is “KEY” and then later if you use a random password generator that would generate password and copy into memory, this type of small tool can help with replacing “KEY” with the “RAND0M P@$$W0rd”.
Some code sample:
Console.WriteLine("Enter filepath:");
var fileName = Console.ReadLine();
var sr = new StreamReader(fileName);
var content = sr.ReadToEnd();
sr.Close();
Console.WriteLine("Enter Search Phrase:");
var searchPhrase = Console.ReadLine();
var matchedIndex = content.IndexOf(searchPhrase);
if(matchedIndex >= 0)
{
    Console.WriteLine("Match found.");
    Console.WriteLine("Enter replacement text:");
    var replacementText = GetSensitiveText();

    var sw = new StreamWriter(fileName);
    sw.Write(content.Replace(searchPhrase, replacementText));
    sw.Flush();
    sw.Close();
}
We prompt for the path to the config file, prompt for the search text. If the search text is found, we prompt for the secret i.e the replace text. But, we don’t echo the new sensitive info to the Console. Then the search text is replaced with new sensitive info and then we write the contents back to the file.
Graylog is a logs only software, very easy to configure and use. There are several nice features, few of the features I liked:
Easy to setup alerts
Easy to setup processing rules and pipelines
Lighter on system resources
Flexible ways of ingesting logs
Like ELK stack, GrayLog can be easily installed, secured for ingesting logs. ELK stack has manageable ElasticAgents i.e client software running on different systems and the client software can be managed from the web interface. ELK stack has support for metrics, GrayLog does not. GrayLog is for logs only and does well.
Installing and configuring GrayLog consists of installing 3 software:
MongoDB
ElasticSearch
GrayLog
The instructions are very easy to follow and are located in GrayLog’s documentation can be accessed by clicking the appropriate link at: https://www.graylog.org/downloads/.
Centralized log management is very important for any tech company of any size. For larger companies, entire company logs need not be centralized but can be segmented based on department or product etc…
ALight Technology And Services Limited is both product and service based company. Currently offers two completely free products – SimplePass and PodDB. With SimplePass, I am not worried much because except for the code there is no data on the server and obviously no customer specific data. With PodDB the risk is slightly higher because there is data but no customer specific data. As of now the AWS account, servers are very highly secured with immediate alerts on login into AWS console or servers, new EC2 instances, instance terminations etc… With the infrastructure, access to infrastructure being secured, the next step is external threats and being able to respond to external threats. These are very important steps prior to developing any products that would possibly contain customer data. What if someone tries to hack by sending malicious payload or DOS (Denial of Service) or DDOS (Distributed Denial of Service)? For identifying, mitigating, preventing such things it’s very important to have proper log management techniques, monitoring of metrics, proper alerts and proper action plan / business continuity plan when such incidents occur. Even if such a thing happened, it’s very important to have logs so that computer forensics can be performed. No company is going to offer free products for ever without generating revenue, in a similar way ALight Technology And Services Limited does have plans of developing revenue generating products or offer services such as architecting, development, hosting etc… Compared with modern days powerful hacking equipment of the anonymous group that calls them the “eyes” (don’t get confused with the intelligence “five eyes”, as a matter of fact the anonymous “eyes” are targeting the five countries that formed the “five eyes” and any whistleblowers like me in this context – I am the whistleblower (but not R&AW) of India’s R&AW equipment capabilities and the atrocities that have been done by the R&AW spies against me), the current state of information security standards are much below.
I have looked into 3 solutions and each of these solutions had strengths and benefits.
What I was looking for:
For example – PodDB has web server logs (NGinx), ASP.Net Core web application logs, and a bunch more of logs from microservice that interacts with the database, microservice that writes some trending data, microservices that queries solr etc… So my log sources are multiple and I want to aggregate all of these along with other logs such as syslog, mariadb audit log etc…
AWS Cloudwatch:
CloudWatch allows easy ingestion, very high availability, metrics, alarms etc… 5GB per month of log ingestion for free. However, live tailing of the logs i.e being able to see logs as they soon as they are ingested is a bit problematic. Even querying / viewing across log groups is a bit problematic. The strength is the definable retention period for each log group. Once ingested the logs cannot be modified, so definitely a great solution if storing logs for compliance reasons. AWS should consider introducing data storage tiers like S3 data storage i.e lifecycle transition – hot logs can be queried and definable period, then lifecycle transition and logs would be stored for archival purpose for some period and then deleted.
2. ELK Stack:
ELK stack consists of ElasticSearch, LogStash and Kibana. ElasticSearch for full-text search capabilities, LogStash for log ingestion, KIbana for visualization. This review is about the self-hosted version. The ELK stack has plenty of features and very easy management if the application and all of it’s components can be properly configured. Built-in support for logs, live tailing of logs, metrics etc… Easier management using ElasticAgents i.e ElasticAgents can be installed on multiple machines and what data should be ingested by each agent can be controlled by the web interface. However, ELK stack seemed a bit heavy in computing resource consumption and for whatever reason, LogStash crashed several times and the system crashed i.e the EC2 instance just hanged, couldn’t even restart. ELK Stack supports, hot and cold log storages i.e the past 15 – 30 days of logs can be kept in the hot storage and the older logs can be automatically moved into cold tier i.e not queried frequently but are kept for various reasons.
3. Graylog:
This is about self hosted version of Graylog. Graylog focuses only on log management. Very easy to setup and ingest logs. Easy querying of logs. No support for metrics. Graylog allows creating snapshots of older data which can be stored elsewhere, restored and searched on a necessity basis.
4. Grafana
This is about the free Grafana account. Grafana offers very generic 50GB log ingestion per month. Logs can be easily ingested into Loki and viewed from Grafana. Metrics can be ingested into Graphite and viewed. Very easy to setup alerts. I have not tried yet but the free tier has 50GB of traces ingestion per month. One of the very best features I liked about Grafana is easy way of tagging logs. If log sources are properly tagged, combining and viewing multiple log sources is very very easy.
Thank you Grafana for such a generous free tier and such a great product.
There seems to be no control of retention period. Grafana paid subscription has control of retention period. The paid version starts at $8 per month. I do have plans about signing up for paid account just before launching commercial products specifically for planning retention i.e either Grafana can store the older logs for few extra months on my behalf or if they can provide a solution to upload into S3 glacier and of course when needed being able to restore from S3 Glacier and being able to search, because storing old logs in S3 Glacier and if there is no way of restoring and searching then the entire purpose of storing old logs would not make sense.
In my continued pursuit of strengthening the security infrastructure at my own startup – ALight Technology And Services Limited, I have written few blog articles in the past regarding securing web applications, importance of audit, logs – part of the NIST Cyber Security Framework. This blog post talks about some things I have done on AWS infrastructure. While running a company with no other employees and while being the target of state-sponsored / state-trained hackers, I ended up learning a lot and now I have dabbled in pretty much everything in computing (expert at development, learning system administration, infosec etc… as part of running my own startup).
I created a base Ubuntu image by enabling ufw, installed auditd, installed cloudwatch log agent, closing unnecessary ports, some custom alerters as soon as a SSH login happens etc… I call this AMI the golden AMI. I also update the golden AMI every few months. The advantage of using a golden AMI like this is any EC2 instance you would launch would have these in place.
I am using ELK stack along with Cloudwatch logs and S3 for logs. ELK stack for log analysis i.e logs are stored for a shorter period, Cloudwatch logs for various other reasons, (can’t disclose) and finally S3 glacier for longer term retention.
With the above mentioned setup, if an incident happens, all the necessary logs would in place for analysis.
I wanted to give a quick introduction to Cloudwatch log agent, AuditD as part of this blog post.
In the past, I have written about a little known utility for collecting metrics known as CollectD. CollectD samples various metrics at configured interval and outputs to various destinations. This particular blog post is about having CollectD send the metrics to a GRPC endpoint, the endpoint can decide how to further process the received data. In this blog post, I would be writing about C# GRPC server for receiving data, but in reality most programming languages that support GRPC can be used.
One more thing, having CollectD use GRPC is slightly complex, because several different libraries need to be installed. Here is a list for Ubuntu, this is not an exhaustive list, but the list of libraries that I had to install on Ubuntu to allow CollectD report metrics using GRPC – gcc, gpp, build-essential, protobuf-compiler-grpc, libprotobuf-dev, protobuf-compiler, libgrpc++-dev. The best way to find any missing libraries is to compile CollectD from source as mentioned in https://collectd.org/download.shtml, and after ./configure look for missing libraries beside grpc until the output shows grpc – yes.
Now for the C# server, here is the .proto file, I have used:
The implementation for the C# server is very simple. I have set the protobuf compiler to only generate the server side code. Create class that inherits from CollectdBase. Override the method PutValues. Remember the request is a stream.
public override async Task<PutValuesResponse> PutValues(IAsyncStreamReader<PutValuesRequest> requestStream, ServerCallContext context)
{
    while (await requestStream.MoveNext())
    {
        var currentItem = requestStream.Current;
        //Do something with currentItem
    }

    return new PutValuesResponse();
}
*Instead of hardcoing IP address or “localhost”, I would say use some name such as “elasticsearch” or “kibana” and then use the HOSTS file for mapping to the actual server. Then even if you have several applications on the same server and if the elasticsearch server gets changed, you don’t have to edit all the config files, you can edit just the hosts file. hosts file is located at /etc/hosts on Linux and C:\Windows\System32\drivers\etc\hosts on Windows.
Now we will discuss about 4 different interesting wrappers:
Buffering Wrapper
Async Wrapper
AspNetBuffering Wrapper
FallbackGroup Wrapper
These 4 loggers are wrappers i.e these loggers don’t write logs directly. Instead they are used to wrap other loggers by providing some interesting functionality that can be used to take advantage based upon necessity and use-case.
Buffering Wrapper
Buffers log events and sends in batches.
As mentioned above in the ElasticSearch example, the wrapper would buffer messages and sends in batches.
There is a very interesting use-case by using AutoFlushWrapper with BufferingWrapper and the actual target that writes the logs, such as writing the logs only when error happen.
2. Async Wrapper
When you don’t need buffering but at the same time if you don’t want your application to wait until logging is done, this could be useful.
This wrapper can be used for wrapping around multiple targets. For example ElasticSearch followed by Cloudwatch followed by File. i.e if the logger is unable to write to ElasticSearch, it would write to Cloudwatch, if that too failed it would write the logs into file.
People who have vast experience in I.T know that security is of utmost importance and needs to be implemented in layers. I had a need to secure my Kibana implementation and I want to thwart hackers. I had two options:
Use VPN
Secure the website
Now, the problem very few VPN’s like Cisco AnyConnect support biometric authentication, ElasticSearch/Kibana’s security options are very less in the self-hosted version.
Thanks to Apache web server for the resuce. Apache web server has this plugin known as mod_auth_oidc, this plugin can be used at the web server level i.e the web server takes care of authorizing users. Kibana is hosted at https://kibana.alightservices.com.
I think this is a very great feature and everyone must use wherever possible for public-facing web applications that would be consumed by OAUTH2 or OpenID.
Moreover this plugin can easily enable SSO (SingleSignOn) features and all of this with just some basic configuration.
This is a almost complete article for ELK stack implementation. However, the authorization restrictions in Kibana are a bit tricky, this article shows authorization at the webserver level for Apache (useful for smaller companies, for fine-grained permissions this might not be useful) i.e This article would serve the purpose of installing the above mentioned software stack. If later I come across anything different or useful when it comes to installing this article would be updated.
This is more like a step by step end to end tutorial, combining information from a lot of different sources. All the appropriate references are provided.
The actual log ingestion, monitoring etc… might be seperate articles.
This is for Ubuntu 20.04. I would suggest at least 4GB RAM. Based upon your requirements follow all or some of the steps
Steps:
Update
2. Install Java
3. Install ElasticSearch
4. Minimal configuration of ElasticSearch
5. Attach a seperate data volume to EC2 instance in AWS (Optional)
6. Start and verify ElasticSearch
7. Installing Kibana
8. Installing NGinx (Optional if NGinx is installed)
9. Installing Apache and securing Apache (Optional if you have a different web server and secured in a different way)
9a) Securing using Auth0 (My preferred way due to some undisclosed reasons)
10. Install LetsEncrypt’s free SSL certificate for NGinx (Must, unless you have different form of SSL certificates)
11. Install LetsEncrypt’s free SSL certificate for Apache (Must, unless you have different form of SSL certificates)
12. Install Dex (Optional, configuring Dex is not covered in this article)
ElasticSearch stores configuration in a file located at /etc/elasticsearch/elasticsearch.yml, for now we would uncomment network.host and set to localhost.
sudo nano /etc/elasticsearch/elasticsearch.yml

// uncomment network.host as shown below, press ctrl + x, Y + Enter i.e save the file
/etc/elasticsearch/elasticsearch.yml
5. Attach a seperate data volume to EC2 instance in AWS (Optional)
Goto AWS Console, EC2 and click Volumes.
AWS Console -> EC2 -> Volumes
Then click Create Volume in the top right.
Create Volume
Select the appropriate volume type, size etc… and create volume
Create Volume
Once the volume is created and available, select the volume and click “Attach Volume” from the “Actions” menu.
Attach Volume
Select the instance for which the volume needs to be attached and click attach.
Attach Volume
Now SSH into the EC2 instance
lsblk
This should show something like this:
lsblk output
nvme1n1 was attached.
Format the newly attached volume
sudo mkfs -t xfs /dev/nvme1n1
Output
Mount to /etc/lib/elasticsearch
sudo mount /dev/nvme1n1 /var/lib/elasticsearch/
For the volume to be automatically mounted edit /etc/fstab. But prior, make a copy because it seems improper fstab configuration can cause problems.
sudo blkid
sudo nano /etc/fstab
Paste the following line by replacing XXX with your own UUID from previous step.
Enable port 80 in Security Group, in firewall (ufw) if you have and navigate to the public IP address of your computer and see if the NGinx page is displayed.
9. Installing Apache and securing Apache (Optional if you have a different web server and secured in a different way)
The next steps are optional, these steps are for securing the website at the server level i.e as a one person company, for now, I need to secure websites directly at the server level. If access rights are an issue, those need to be handled at the application level.
ZmartZone IAM. (n.d.-a). GitHub – zmartzone/mod_auth_openidc: OpenID Certified<sup>TM OpenID Connect Relying Party implementation for Apache HTTP Server 2.x. GitHub. Retrieved January 2, 2023, from <span>https://github.com/zmartzone/mod_auth_openidc
We use cookies on our website to give you the most relevant experience by remembering your preferences and repeat visits. By clicking “Accept All”, you consent to the use of ALL the cookies. However, you may visit "Cookie Settings" to provide a controlled consent.
This website uses cookies to improve your experience while you navigate through the website. Out of these, the cookies that are categorized as necessary are stored on your browser as they are essential for the working of basic functionalities of the website. We also use third-party cookies that help us analyze and understand how you use this website. These cookies will be stored in your browser only with your consent. You also have the option to opt-out of these cookies. But opting out of some of these cookies may affect your browsing experience.
Necessary cookies are absolutely essential for the website to function properly. These cookies ensure basic functionalities and security features of the website, anonymously.
Cookie
Duration
Description
cookielawinfo-checkbox-advertisement
1 year
Set by the GDPR Cookie Consent plugin, this cookie is used to record the user consent for the cookies in the "Advertisement" category .
cookielawinfo-checkbox-analytics
11 months
This cookie is set by GDPR Cookie Consent plugin. The cookie is used to store the user consent for the cookies in the category "Analytics".
cookielawinfo-checkbox-functional
11 months
The cookie is set by GDPR cookie consent to record the user consent for the cookies in the category "Functional".
cookielawinfo-checkbox-necessary
11 months
This cookie is set by GDPR Cookie Consent plugin. The cookies is used to store the user consent for the cookies in the category "Necessary".
cookielawinfo-checkbox-others
11 months
This cookie is set by GDPR Cookie Consent plugin. The cookie is used to store the user consent for the cookies in the category "Other.
cookielawinfo-checkbox-performance
11 months
This cookie is set by GDPR Cookie Consent plugin. The cookie is used to store the user consent for the cookies in the category "Performance".
viewed_cookie_policy
11 months
The cookie is set by the GDPR Cookie Consent plugin and is used to store whether or not user has consented to the use of cookies. It does not store any personal data.
Functional cookies help to perform certain functionalities like sharing the content of the website on social media platforms, collect feedbacks, and other third-party features.
Performance cookies are used to understand and analyze the key performance indexes of the website which helps in delivering a better user experience for the visitors.
Analytical cookies are used to understand how visitors interact with the website. These cookies help provide information on metrics the number of visitors, bounce rate, traffic source, etc.
Advertisement cookies are used to provide visitors with relevant ads and marketing campaigns. These cookies track visitors across websites and collect information to provide customized ads.