In a previous blog post – Custom Layout Renderer for NLog using C#, I have mentioned about how to create a class inheriting LayoutRenderer and writing custom Layout Renderer.
This blog post talks about inheriting from WrapperLayoutRendererBase class.
The WrapperLayoutRendererBase class has a method with the signature:
protected override string Transform(string text)
This method needs to be overridden. The nice thing about using this class is other layout renderers can be used in combination.
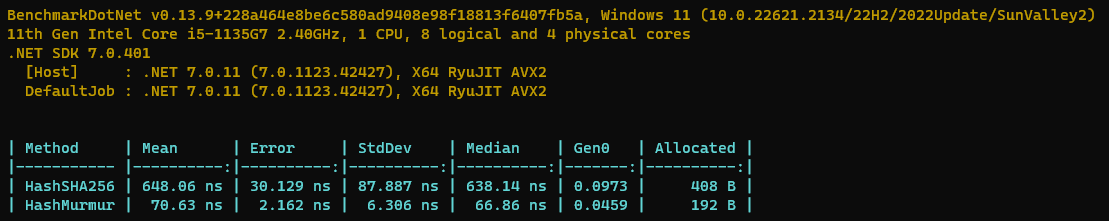
Here is a GitHub repo implementing hash functions that can be used as LayoutRenderers.
In the above scenarion, we can use ${name} when defining a layout, of course instead of returning static string we can do something useful based on the use-case.
Class:
Define a new class inherited from NLog.LayoutRenderers.LayoutRenderer. Use class attribute LayoutRenderer(“name”). LayoutRenderer is an abstract class, implement the class by overriding Append(StringBuilder builder, LogEventInfo logEvent) method i.e Append the value that needs to be added to the log by appending to the StringBuilder parameter.
[LayoutRenderer("Example")]
public class ExampleLayoutRenderer : NLog.LayoutRenderers.LayoutRenderer
{
    public string Value { get; set; }

    protected override void Append(StringBuilder builder, LogEventInfo logEvent)
    {
        builder.Append("Value");
    }
}
Extra parameters can be passed and assigned as properties of the custom class.
[LayoutRenderer("example")]
public class ExampleLayoutRenderer : NLog.LayoutRenderers.LayoutRenderer
{
    public string Value { get; set; }

    protected override void Append(StringBuilder builder, LogEventInfo logEvent)
    {
        // Your custom code
        builder.Append(Value);
    }
}
In the config file the custom layout renderer with params can be used like follows:
{example}

{example:value=abc}
Sometimes, in logs we write some data that might be needed for identifying but not necessarily the real value and for various reasons we might just need a hash. For example: SessionId / Some Cookie Value / IP address etc… Having a custom renderer for hashing such a value could be used.
Very few lines of code, i.e hashing and appending to a stringbuilder would solve the need i.e 2 – 3 lines of code. But, I think the 2 – 3 lines of code could be helpful for other people. I am considering creating an opensource version. I might or might not release nuget package. If I release nuget package, I would definitely make an anouncement. Anyway, not a big open-source project, but just few lines of code.
This blog post is a general blog post on how centralized logging has been implemented, some of the tools used while keeping the costs low.
Having the ability to maintain logs is very important for software companies, even small startups. Centralized logging, monitoring, metrics and alerts are also important.
Log ingestion is done using FluentD. FluentD is installed on all the servers and even a Golden Base AMI has been created with FluentD installed.
Grafana Loki is used as the log ingestion server.
Grafana front-end for viewing logs from Loki.
FluentD has been configured to set different labels for different log sources, the output is written into Loki and into file output.
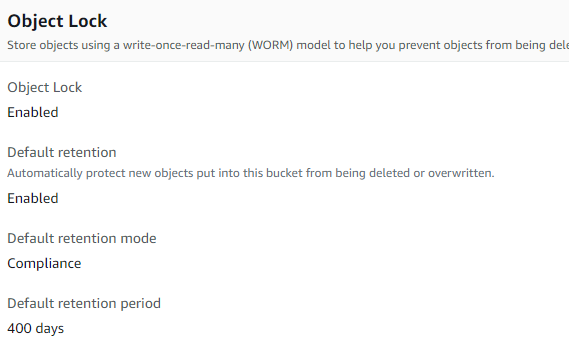
The output files would be zipped and uploaded into S3 with lifecycle policies. S3 buckets can be configured to be immutable i.e once a file is uploaded, can’t be deleted or re-written or modified until a specified period.
Loki has been configured with a smaller retention period. I wish Grafana Loki supported something like retaining time slices. More on the concept of time slices later in this blog post.
Loki can be configured for a longer retention period but unnecessary EBS storage costs. S3 Standard Infrequent Access or S3 Glacier Instant Retrieval are much cheaper for archival data. Based on your needs you can configure the system.
A new component in C# is being developed to ingest logs into Loki on a need basis. I will definitely post some sample code of the new component.
With the above configuration in place, once logs are written and within 6 minutes, the logs become immutable. Let’s say something happened, and was noticed within 1 day. I can immediately change the retention period of Loki and keep the log retention for longer period. If I saw some abnormality and if the logs are no longer available in Loki due to shorter retention period. The new component being developed would ingest the archived logs from S3 into Loki with the old timestamps. Under normal circumstances this wouldn’t be required, but there is no point in having archived logs that cannot be ingested and searched when required.
Some sample config elements for FluentD:
Code block for ingesting logs from CloudWatch:
I am ingesting CloudTrail logs, I would write a blog post or a video sometime later.
The above configs are pretty much self-explanatory. Using Loki, Grafana are also very easy. But most important thing, configure and use Grafana with a 3rd party login instead of just username and password. I can’t stress the importance of MFA and if possible use YubiKey Bio. Most other forms of MFA have vulnerabilities and are hackable considering the advanced capabilities of the R&AW / Mafia / Anonymous hackers group equipment.
Metrics:
I am using collectd, Carbon, Grafana cloud for metrics. i.e all the servers have collectd, collectd ingests metrics into Carbon, Carbon forwards these metrics into Grafana cloud. Based upon patterns, set threshold alerts. I am planning to ingest custom additional metrics. But that’s planned for later. Definitely when I get to this phase, I would write some blog posts.
Alerts:
Considering the R&AW / Mafia / Anonymous hackers threat (capabilities of the equipment) – the most damage can happen if they login into AWS Console / SSH into servers. I have wrote some custom code for a lambda that would parse cloudwatch logs looking for AWS console login pattern and sends an alert. This Lambda runs once every minute. The anonymous hackers / spies / R&AW / Mafia might screenshot my AWS account or even record video or even might show my screen in a live video but they can’t login because of biometric MFA authentication.
Similarly I have configured my servers to send an email alert as soon as a SSH login happens. I access my Linux servers from within AWS website using EC2 Instance Connect rather than direct SSH. In other words, if anyone wants to access my Linux servers, they have to first login into AWS console using YubiKey Bio – in other words, no one else can login as of now.
I can provide code samples for the above 2 activities in a later blog post.
TimeSlices:
Earlier, I mentioned about a concept – TimeSlices. I don’t need all logs forever, if I want a certain logstream during a certain period, retain those logs.
Similarly another nice to have feature would be the ability to configure different retention periods for different types of logs. For example, remove traces after x day, remove debug after y days, remove info after z day. Retain Warn, Error, Critical for a longer period.
I am hoping this blog post helps someone. If anyone needs any help with architecting, planning, designing, developing for horizontal and vertical scalability or want any help with centralized logging or enterprise search using Solr or ElasticSearch or want to reduce costs by rightsizing, please do contact me. I offer free consultation and we can agree on the work that needs to be performed and the pricing.
Recently, I have been writing on log management tools and techniques. Very recently, I am even evaluating Grafana Loki on-premise. I would write a review in few days regarding Grafana Loki. As of now from server hardware requirements, log volume ingestion standpoint Grafana seems excellent compared with ELK stack and GrayLog.
This blog post is a general blog post. For proper log management, we need different components.
Log ingestion client
Log ingestion server
Log Viewer
Some kind of long-term archiver that can restore certain logs on required basis (Optional)
Log Ingestion Client:
FluentD is the best log ingestion client for several reasons. Every log ingestion stack have their own log ingestion clients. ELK Stack has LogBeats, MetricBeats etc… GrayLog does not have a client of its own but supports log ingestion via Gelf / RSysLog etc… Grafana Loki has PromTail.
FluentD can collect logs from various sources and ingest into various destinations. Here is the best part – multiple destinations based on rules. For example certain logs can be ingested into Log servers and uploaded to S3. Very easy to configure and customize and there are plenty of plugins for sources, destinations and even customizing logs such as adding tags, extracting values etc… Here is a list of plugins.
FluentD can ingest into Grafana Loki, ELK stack, GrayLog and much more. If you use FluentD, if the target needs to be changed, its just a matter of configuration.
Log Ingestion Server:
ELK vs GrayLog vs Grafana Loki vs Seq and several others. As of now, I have evaluated ELK, GrayLog and Grafana Loki.
Log Viewer:
Grafana front end with Loki backend, GrayLog, Kibana frontend with ElasticSearch backend in ELK stack.
Long-Term Archiving:
ELK stack has lifecycle rules for backing up and restoring. GrayLog can be configured to close indexes and re-open on a necessary basis. Grafana Loki has retention and compactor settings. However, I have not figured out how to re-open compacted gz files on a necessity basis.
Apart from these, I am using Graphite for metrics. I do have plans for ingesting additional metrics. As of now, I am using the excellent hosted solution provided by Grafana. As of now, in the near-term I don’t have plans for self-hosting metrics. But Grafana front-end supports several data sources.
I am thinking of collecting certain extra metrics without overloading the application (might be an after-thought or might not be). I am collecting NGinx logs in json format. The URL, upstream connect, upstream response time are being logged. Now, by parsing these logs, the name of the ASP.Net MVC controller, name of the Action Method, the HTTP verb can be captured. Now, I can use these as metrics. I can very easily add metrics at the database layer in the application. With these metrics, I can easily identify bottlenecks, slow performing methods and even monitor average response times etc… and set alerts.
The next few days or weeks would be about the custom metric collection based on logs. You can expect few blog posts on some FluentD configuration, C# code etc… FluentD does have some plugins for collecting certain metrics but we will look into some C# code for parsing, sending metrics into Graphite.
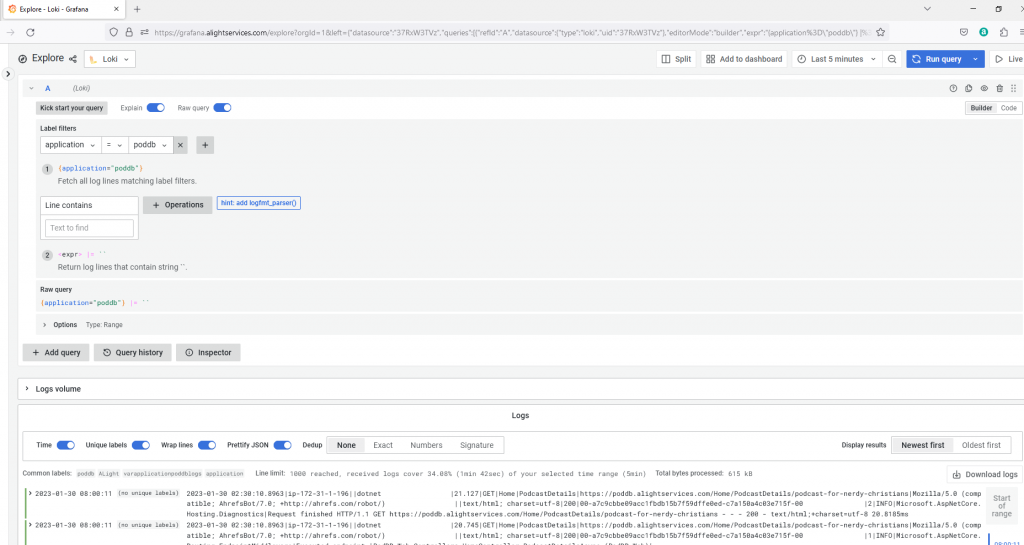
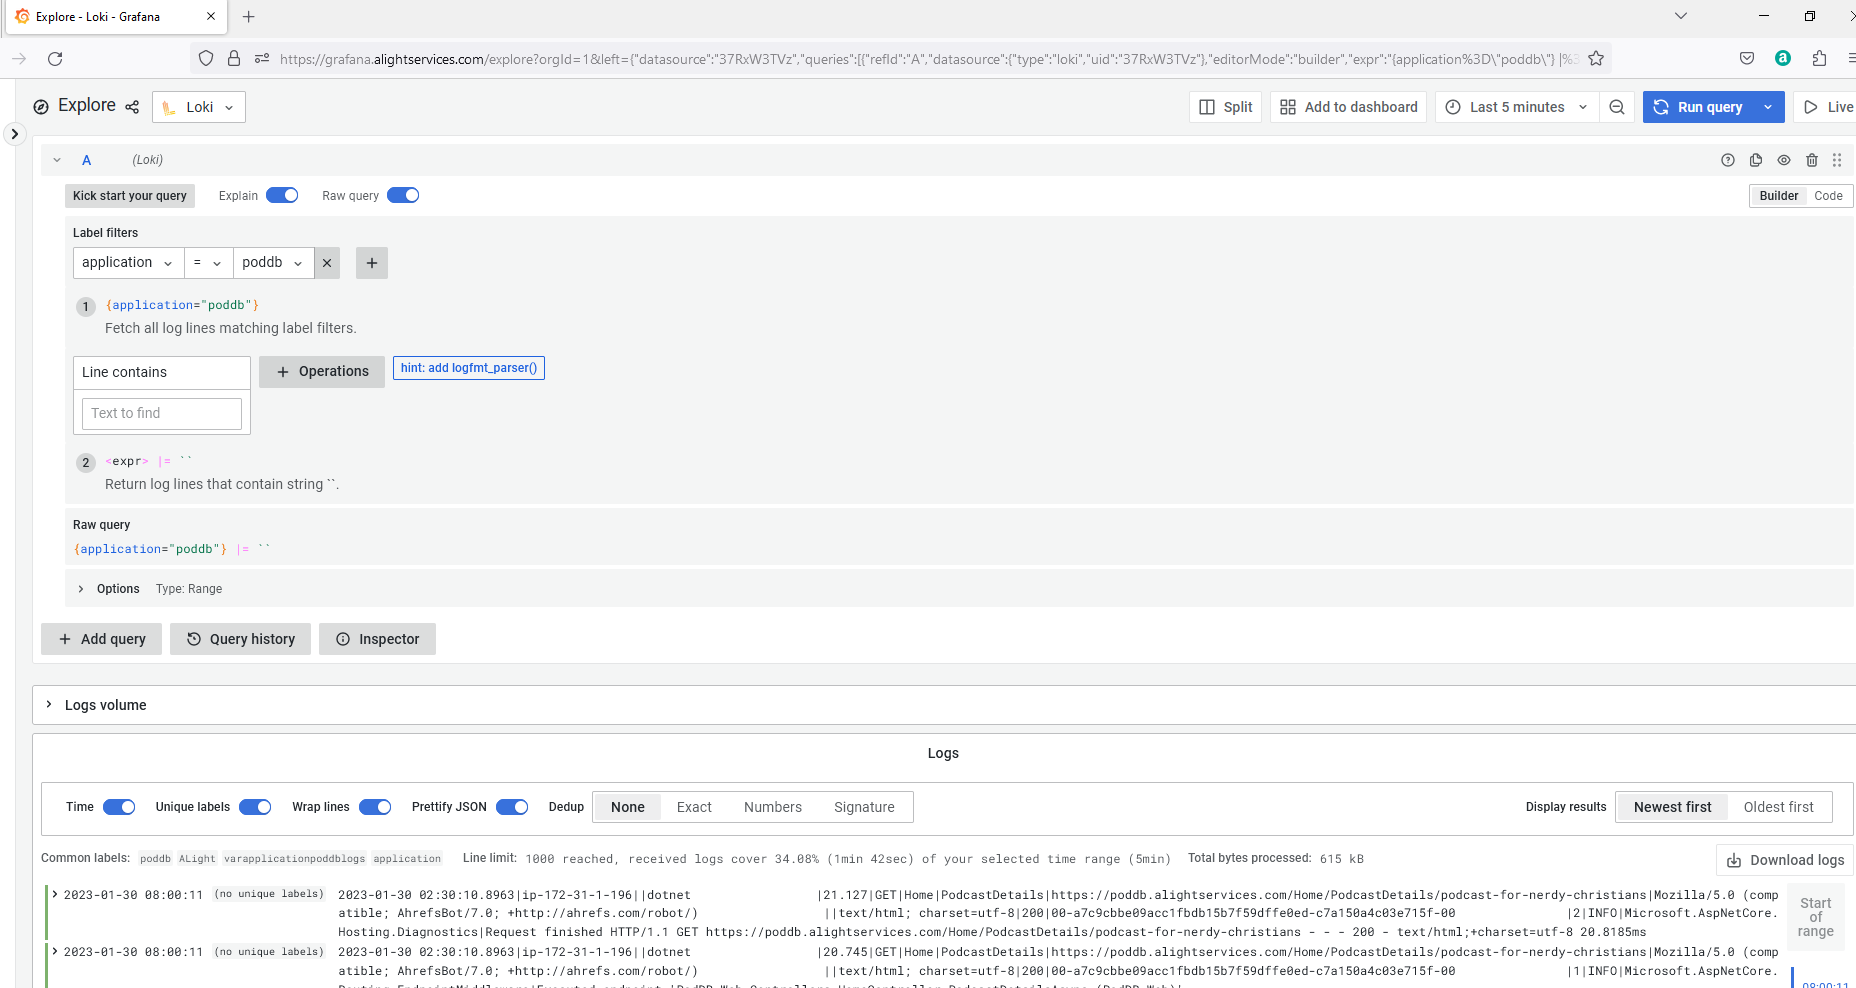
Here is a screenshot from the self-hosted Grafana front-end for Loki logs:
Grafana showing Loki logs for PodDB
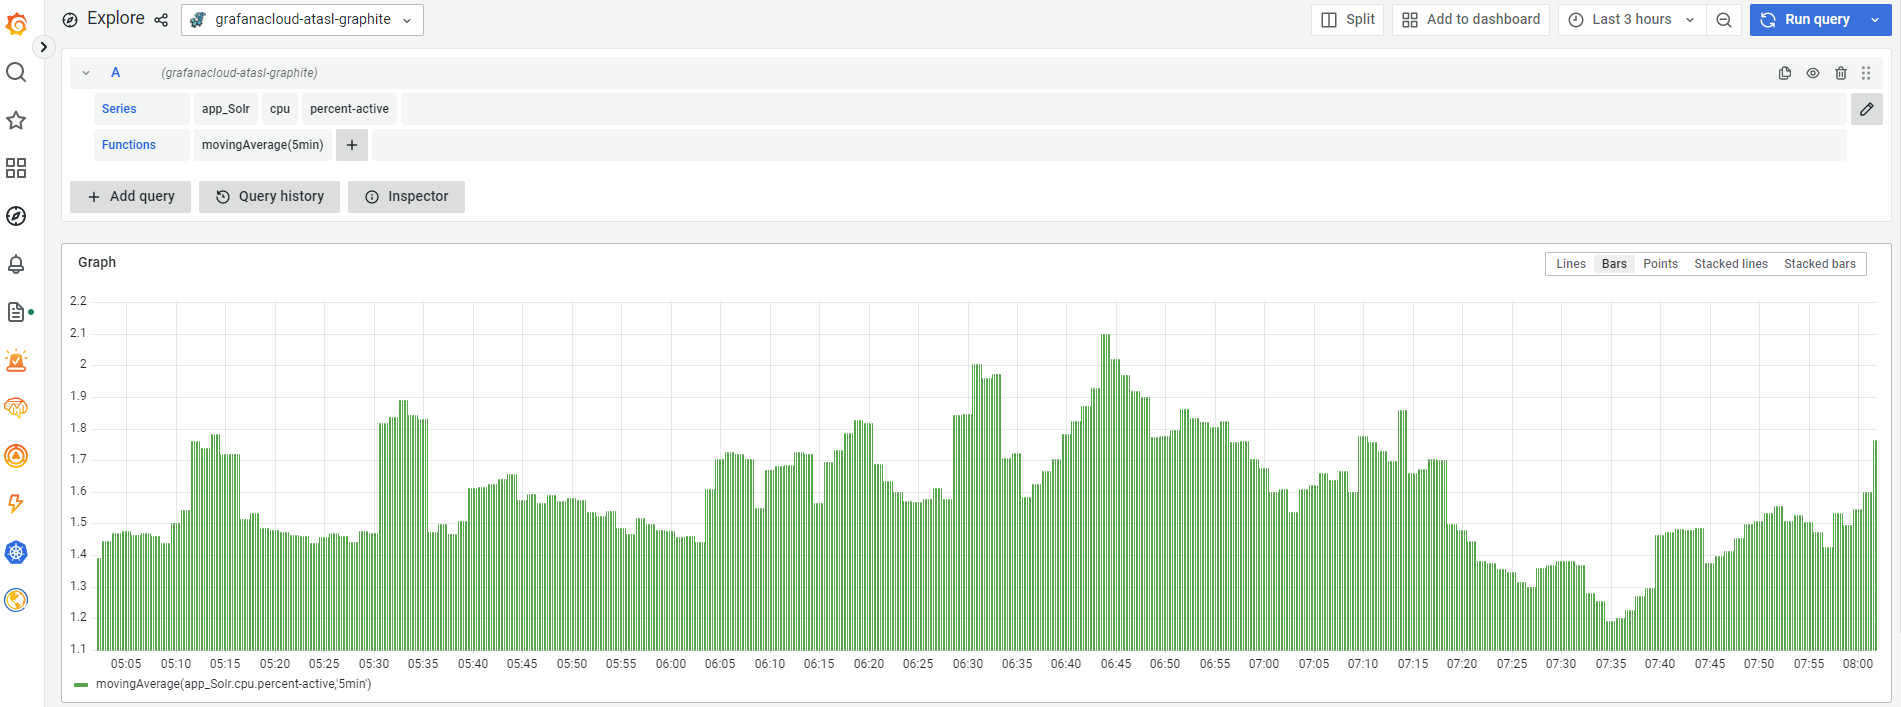
Here is a screenshot from Grafana.com hosted showing Graphite metrics
Graphite Solr Backend Server CPU usage
I am hoping this blog posts helps someone. Some C# code for working with Logs, Metrics and Graphite over the next few days / weeks.
And I have discussed about a possibility of capturing more information in logs only when needed such as in the case of errors or exceptions in the following blog post:
I am planning to use Gelf logging for easier compatibility reasons. Gelf logs can be ingested into pretty much every major centralized logging platforms such as: Kibana, GrayLog, Seq, Grafana. Some would require some intermediary software to accept Gelf formatted logs and some can directly ingest Gelf formatted logs. However, for various reasons, sometimes the logging server might not be available, specifically when the log ingestors are not in a cluster. Log files can be easily ingested into the above mentioned centralized logging agents using different sofware.
Based on the above use-case I wanted to use Gelf for directly logging into the centralized logging server and as a failover, I want to write the logs to a file that would get ingested at a later point by some other software.
Now, by combing the previous post example, we can achieve AspNetBuffering and ingest different levels of logs only when errors occur. The code samples should be very easy to understand.
In the above code we have wrapped Gelf logger, File logger inside a FallBackGroup logger. The FallBackGroup logger is wrapped inside a PostFilteringWrapper. The PostFilteringWrapper is wrapped inside a AspNetBufferingWrapper.
In the above code in the <rules> section we are sending all Debug and above logs to the AspNetBufferingWrapper.
Now AspNetBufferingWrapper buffers the log messages for an entire request, response cycle and sends the log messages to the PostFilteringWrapper.
The PostFilteringWrapper sees if there are any Warnings or above loglevel, if yes sends all the messages that have Debug and above loglevels. Else sends Info and above messages. The target of PostFilteringWrapper is the FallbackGroup logger which receives these messages.
The FallBackGroup logger attempts to use the Gelf logger, if the Gelf logger is unable to process the messages, the logs are sent to the File logger.
And I have discussed about a possibility of capturing more information in logs only when needed such as in the case of errors or exceptions in the following blog post:
The above configuration by default logs Info and above logs, but if there is a Warn or higher, logs debug or higher. For this to work properly obviously this logger has to receive Debug messages otherwise there is no point in using this logger.
Now combing these two loggers, here is an example:
I have evaluated few different centralized logging tools, specifically the following:
Grafana Loki
Kibana
Graylog
Seq
In the short-term, I am using Graylog, but in the next few years, I might choose a different option.
The key features I have been looking for are:
Lower hardware requirements – for a small startup without any revenue yet, I didn’t want to spend too much.
Customizable retention period of logs
Being able to backup logs to some cheaper storage such as S3 rather than having 100’s of GB on EBS volumes.
Easily able to restore a smaller portion of logs for a certain period and be able to search.
Being able to ingest various types of logs
Let me explain my personal requirements clearly.
I want to ingest all the logs from all possible sources i.e system logs, software logs such as web server, mysql audit logs, custom application logs. Currently my applications and servers are generating approximately 800Mb of logs per day. That would be about 25Gb per month and 300Gb per year. I want to retain logs for a longer period in archives for various reasons. I currently don’t have any products that need to meet compliance requirements. I arbitrarily choose 400 days worth of log retention and the logs need to be immutable. Once the logs are ingested, the logs need to be stored for 400 days and should not be modified. The reason being in the future if I need to meet compliance requirements, it would be easy to change the retention period and the integrity of the logs can be verified.
I have read about but have not evaluated the following yet:
Self-Hosted Seq
Self-Hosted Grafana Loki
Given the above I will tell you the advantages and disadvantages of each solution.
Grafana Loki hosted:
Grafana has a very generous free tier with 50Gb log ingestion and 14 days retention. The paid customized plans pricing was not clear. Considering the logs are hosted by a 3rd party, I would hope they would introduce some additional security measures such as allowing log ingestion from only certain IP’s etc… Even if the API keys are stolen or spied upon, the hackers cannot pollute the log data.
Self-Hosted ELK stack:
This is one very great solution but the setup and versions compatibility is very problematic. Self-Hosted ELK stack is a little heavy on resources. But definitely worth for SME’s who have the budget for the required hardware and few Server Admin professionals on team. As of now, because of the R&AW harassment, impersonation, I don’t know when I would launch commercial products. And these are recurring expenses, not one time expenses, so I am trying to set myself for success with smaller monthly server expenses. I wish these psycho human rights violators get arrested. There are ways to export backups into S3, almost a perfect solution
GrayLog OpenSource:
GrayLog is a bit heavy on system resources but requires lesser resources compared with ELK stack. Indexes can be closed but backing up and restoring are not directly part of the application. Probably part of the GrayLog paid version.
AWS CloudWatch:
AWS Cloudwatch is perfect if there is a need for compliance with retention policies and immutability. CloudWatch logs can be exported into S3 buckets. S3 buckets can be configured to be immutable for compliance reasons and S3 lifecycle policies can be defined for removal of data etc… But querying data is a little problematic compared with the ease of other solutions.
Seq:
Seq has a free version, seemed to be light-weight. Very easy to write extensions using C# (My primary development language). There is no direct plugin for for exporting data into S3 but a customizable plugin might be possible. There are plugins for writing into an Archive file. The Archive file can be exported to S3 periodically. Trying on localhost is very easy – pull a docker image and run the docker image. No complicated setup.
Self-hosted Grafana Loki:
I think pretty much all the capabilities of hosted Grafana Loki might be possible. However, I haven’t tried yet.
In all the above solutions, logs could be tampered by hackers except with AWS Cloudwatch. Once ingested, the logs stay there un-tampered. If Admin’s account gets hacked, the retention period can be changed or log streams might be deleted, but cannot be tampered.
As of now, I have not yet found the perfect solution for my requirements, but I am hoping this blog post helps some people in deciding between various different centralized logging solutions based upon your own requirements.
Centralized log management is very important for any tech company of any size. For larger companies, entire company logs need not be centralized but can be segmented based on department or product etc…
ALight Technology And Services Limited is both product and service based company. Currently offers two completely free products – SimplePass and PodDB. With SimplePass, I am not worried much because except for the code there is no data on the server and obviously no customer specific data. With PodDB the risk is slightly higher because there is data but no customer specific data. As of now the AWS account, servers are very highly secured with immediate alerts on login into AWS console or servers, new EC2 instances, instance terminations etc… With the infrastructure, access to infrastructure being secured, the next step is external threats and being able to respond to external threats. These are very important steps prior to developing any products that would possibly contain customer data. What if someone tries to hack by sending malicious payload or DOS (Denial of Service) or DDOS (Distributed Denial of Service)? For identifying, mitigating, preventing such things it’s very important to have proper log management techniques, monitoring of metrics, proper alerts and proper action plan / business continuity plan when such incidents occur. Even if such a thing happened, it’s very important to have logs so that computer forensics can be performed. No company is going to offer free products for ever without generating revenue, in a similar way ALight Technology And Services Limited does have plans of developing revenue generating products or offer services such as architecting, development, hosting etc… Compared with modern days powerful hacking equipment of the anonymous group that calls them the “eyes” (don’t get confused with the intelligence “five eyes”, as a matter of fact the anonymous “eyes” are targeting the five countries that formed the “five eyes” and any whistleblowers like me in this context – I am the whistleblower (but not R&AW) of India’s R&AW equipment capabilities and the atrocities that have been done by the R&AW spies against me), the current state of information security standards are much below.
I have looked into 3 solutions and each of these solutions had strengths and benefits.
What I was looking for:
For example – PodDB has web server logs (NGinx), ASP.Net Core web application logs, and a bunch more of logs from microservice that interacts with the database, microservice that writes some trending data, microservices that queries solr etc… So my log sources are multiple and I want to aggregate all of these along with other logs such as syslog, mariadb audit log etc…
AWS Cloudwatch:
CloudWatch allows easy ingestion, very high availability, metrics, alarms etc… 5GB per month of log ingestion for free. However, live tailing of the logs i.e being able to see logs as they soon as they are ingested is a bit problematic. Even querying / viewing across log groups is a bit problematic. The strength is the definable retention period for each log group. Once ingested the logs cannot be modified, so definitely a great solution if storing logs for compliance reasons. AWS should consider introducing data storage tiers like S3 data storage i.e lifecycle transition – hot logs can be queried and definable period, then lifecycle transition and logs would be stored for archival purpose for some period and then deleted.
2. ELK Stack:
ELK stack consists of ElasticSearch, LogStash and Kibana. ElasticSearch for full-text search capabilities, LogStash for log ingestion, KIbana for visualization. This review is about the self-hosted version. The ELK stack has plenty of features and very easy management if the application and all of it’s components can be properly configured. Built-in support for logs, live tailing of logs, metrics etc… Easier management using ElasticAgents i.e ElasticAgents can be installed on multiple machines and what data should be ingested by each agent can be controlled by the web interface. However, ELK stack seemed a bit heavy in computing resource consumption and for whatever reason, LogStash crashed several times and the system crashed i.e the EC2 instance just hanged, couldn’t even restart. ELK Stack supports, hot and cold log storages i.e the past 15 – 30 days of logs can be kept in the hot storage and the older logs can be automatically moved into cold tier i.e not queried frequently but are kept for various reasons.
3. Graylog:
This is about self hosted version of Graylog. Graylog focuses only on log management. Very easy to setup and ingest logs. Easy querying of logs. No support for metrics. Graylog allows creating snapshots of older data which can be stored elsewhere, restored and searched on a necessity basis.
4. Grafana
This is about the free Grafana account. Grafana offers very generic 50GB log ingestion per month. Logs can be easily ingested into Loki and viewed from Grafana. Metrics can be ingested into Graphite and viewed. Very easy to setup alerts. I have not tried yet but the free tier has 50GB of traces ingestion per month. One of the very best features I liked about Grafana is easy way of tagging logs. If log sources are properly tagged, combining and viewing multiple log sources is very very easy.
Thank you Grafana for such a generous free tier and such a great product.
There seems to be no control of retention period. Grafana paid subscription has control of retention period. The paid version starts at $8 per month. I do have plans about signing up for paid account just before launching commercial products specifically for planning retention i.e either Grafana can store the older logs for few extra months on my behalf or if they can provide a solution to upload into S3 glacier and of course when needed being able to restore from S3 Glacier and being able to search, because storing old logs in S3 Glacier and if there is no way of restoring and searching then the entire purpose of storing old logs would not make sense.
This is a almost complete article for ELK stack implementation. However, the authorization restrictions in Kibana are a bit tricky, this article shows authorization at the webserver level for Apache (useful for smaller companies, for fine-grained permissions this might not be useful) i.e This article would serve the purpose of installing the above mentioned software stack. If later I come across anything different or useful when it comes to installing this article would be updated.
This is more like a step by step end to end tutorial, combining information from a lot of different sources. All the appropriate references are provided.
The actual log ingestion, monitoring etc… might be seperate articles.
This is for Ubuntu 20.04. I would suggest at least 4GB RAM. Based upon your requirements follow all or some of the steps
Steps:
Update
2. Install Java
3. Install ElasticSearch
4. Minimal configuration of ElasticSearch
5. Attach a seperate data volume to EC2 instance in AWS (Optional)
6. Start and verify ElasticSearch
7. Installing Kibana
8. Installing NGinx (Optional if NGinx is installed)
9. Installing Apache and securing Apache (Optional if you have a different web server and secured in a different way)
9a) Securing using Auth0 (My preferred way due to some undisclosed reasons)
10. Install LetsEncrypt’s free SSL certificate for NGinx (Must, unless you have different form of SSL certificates)
11. Install LetsEncrypt’s free SSL certificate for Apache (Must, unless you have different form of SSL certificates)
12. Install Dex (Optional, configuring Dex is not covered in this article)
ElasticSearch stores configuration in a file located at /etc/elasticsearch/elasticsearch.yml, for now we would uncomment network.host and set to localhost.
sudo nano /etc/elasticsearch/elasticsearch.yml

// uncomment network.host as shown below, press ctrl + x, Y + Enter i.e save the file
/etc/elasticsearch/elasticsearch.yml
5. Attach a seperate data volume to EC2 instance in AWS (Optional)
Goto AWS Console, EC2 and click Volumes.
AWS Console -> EC2 -> Volumes
Then click Create Volume in the top right.
Create Volume
Select the appropriate volume type, size etc… and create volume
Create Volume
Once the volume is created and available, select the volume and click “Attach Volume” from the “Actions” menu.
Attach Volume
Select the instance for which the volume needs to be attached and click attach.
Attach Volume
Now SSH into the EC2 instance
lsblk
This should show something like this:
lsblk output
nvme1n1 was attached.
Format the newly attached volume
sudo mkfs -t xfs /dev/nvme1n1
Output
Mount to /etc/lib/elasticsearch
sudo mount /dev/nvme1n1 /var/lib/elasticsearch/
For the volume to be automatically mounted edit /etc/fstab. But prior, make a copy because it seems improper fstab configuration can cause problems.
sudo blkid
sudo nano /etc/fstab
Paste the following line by replacing XXX with your own UUID from previous step.
Enable port 80 in Security Group, in firewall (ufw) if you have and navigate to the public IP address of your computer and see if the NGinx page is displayed.
9. Installing Apache and securing Apache (Optional if you have a different web server and secured in a different way)
The next steps are optional, these steps are for securing the website at the server level i.e as a one person company, for now, I need to secure websites directly at the server level. If access rights are an issue, those need to be handled at the application level.
ZmartZone IAM. (n.d.-a). GitHub – zmartzone/mod_auth_openidc: OpenID Certified<sup>TM OpenID Connect Relying Party implementation for Apache HTTP Server 2.x. GitHub. Retrieved January 2, 2023, from <span>https://github.com/zmartzone/mod_auth_openidc
We use cookies on our website to give you the most relevant experience by remembering your preferences and repeat visits. By clicking “Accept All”, you consent to the use of ALL the cookies. However, you may visit "Cookie Settings" to provide a controlled consent.
This website uses cookies to improve your experience while you navigate through the website. Out of these, the cookies that are categorized as necessary are stored on your browser as they are essential for the working of basic functionalities of the website. We also use third-party cookies that help us analyze and understand how you use this website. These cookies will be stored in your browser only with your consent. You also have the option to opt-out of these cookies. But opting out of some of these cookies may affect your browsing experience.
Necessary cookies are absolutely essential for the website to function properly. These cookies ensure basic functionalities and security features of the website, anonymously.
Cookie
Duration
Description
cookielawinfo-checkbox-advertisement
1 year
Set by the GDPR Cookie Consent plugin, this cookie is used to record the user consent for the cookies in the "Advertisement" category .
cookielawinfo-checkbox-analytics
11 months
This cookie is set by GDPR Cookie Consent plugin. The cookie is used to store the user consent for the cookies in the category "Analytics".
cookielawinfo-checkbox-functional
11 months
The cookie is set by GDPR cookie consent to record the user consent for the cookies in the category "Functional".
cookielawinfo-checkbox-necessary
11 months
This cookie is set by GDPR Cookie Consent plugin. The cookies is used to store the user consent for the cookies in the category "Necessary".
cookielawinfo-checkbox-others
11 months
This cookie is set by GDPR Cookie Consent plugin. The cookie is used to store the user consent for the cookies in the category "Other.
cookielawinfo-checkbox-performance
11 months
This cookie is set by GDPR Cookie Consent plugin. The cookie is used to store the user consent for the cookies in the category "Performance".
viewed_cookie_policy
11 months
The cookie is set by the GDPR Cookie Consent plugin and is used to store whether or not user has consented to the use of cookies. It does not store any personal data.
Functional cookies help to perform certain functionalities like sharing the content of the website on social media platforms, collect feedbacks, and other third-party features.
Performance cookies are used to understand and analyze the key performance indexes of the website which helps in delivering a better user experience for the visitors.
Analytical cookies are used to understand how visitors interact with the website. These cookies help provide information on metrics the number of visitors, bounce rate, traffic source, etc.
Advertisement cookies are used to provide visitors with relevant ads and marketing campaigns. These cookies track visitors across websites and collect information to provide customized ads.