Add free search for your website. Sign up now! https://webveta.alightservices.com/
Categories
Cloudwatch Logging

High level architecture of centralized logging and retention strategy at ALight Technology And Services Limited

This blog post is a general blog post on how centralized logging has been implemented, some of the tools used while keeping the costs low.

Having the ability to maintain logs is very important for software companies, even small startups. Centralized logging, monitoring, metrics and alerts are also important.

Log ingestion is done using FluentD. FluentD is installed on all the servers and even a Golden Base AMI has been created with FluentD installed.

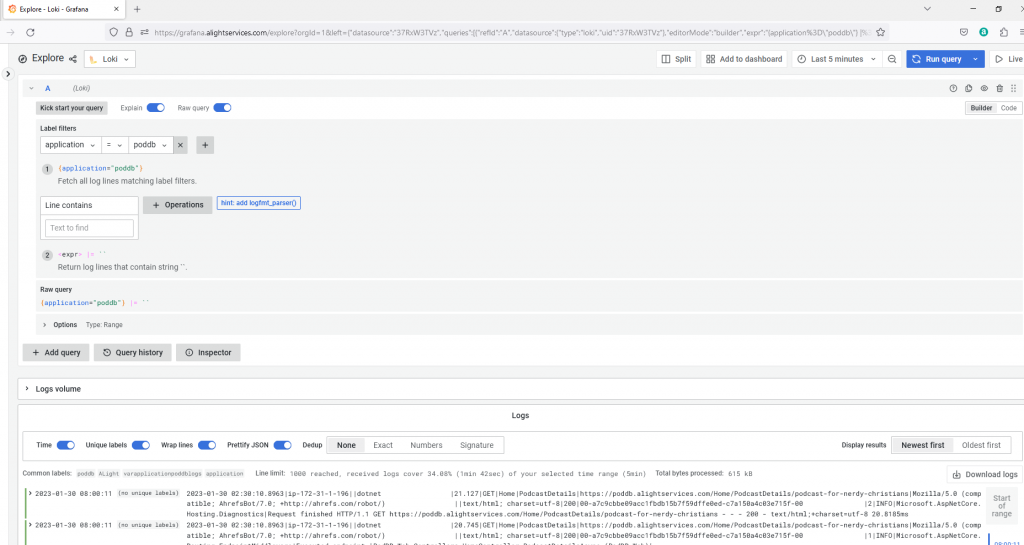
Grafana Loki is used as the log ingestion server.

Grafana front-end for viewing logs from Loki.

FluentD has been configured to set different labels for different log sources, the output is written into Loki and into file output.

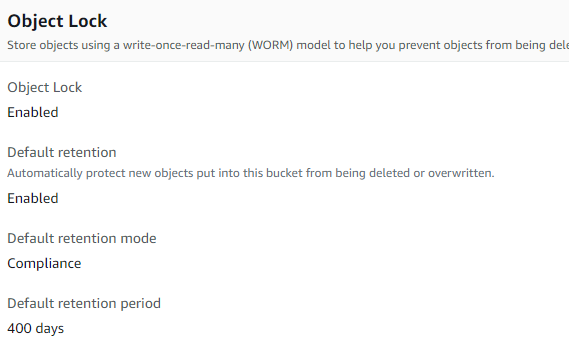
The output files would be zipped and uploaded into S3 with lifecycle policies. S3 buckets can be configured to be immutable i.e once a file is uploaded, can’t be deleted or re-written or modified until a specified period.

Loki has been configured with a smaller retention period. I wish Grafana Loki supported something like retaining time slices. More on the concept of time slices later in this blog post.

Loki can be configured for a longer retention period but unnecessary EBS storage costs. S3 Standard Infrequent Access or S3 Glacier Instant Retrieval are much cheaper for archival data. Based on your needs you can configure the system.

A new component in C# is being developed to ingest logs into Loki on a need basis. I will definitely post some sample code of the new component.

With the above configuration in place, once logs are written and within 6 minutes, the logs become immutable. Let’s say something happened, and was noticed within 1 day. I can immediately change the retention period of Loki and keep the log retention for longer period. If I saw some abnormality and if the logs are no longer available in Loki due to shorter retention period. The new component being developed would ingest the archived logs from S3 into Loki with the old timestamps. Under normal circumstances this wouldn’t be required, but there is no point in having archived logs that cannot be ingested and searched when required.

Some sample config elements for FluentD:

Code block for ingesting logs from CloudWatch:

I am ingesting CloudTrail logs, I would write a blog post or a video sometime later.

<source>
  @id cloudwatch_logs
  @type cloudwatch_logs
  tag cloudwatch.cloudtrail
  log_group_name <LOG_GROUP_NAME>
  add_log_group_name false
  use_log_group_name_prefix true
  log_stream_name <LOG_STREAM_PREFIX>
  use_log_stream_name_prefix true
  region <AWS-REGION>
  include_metadata true
  <parse>
   @type json
  </parse>
  <storage>
    @type local
    path /var/log/td-agent/cloudwatch_cloudtrail.json
  </storage>
</source>

Sample for log files:

<source>
  @type tail
  @id grafana
  path /var/log/grafana/*.log
  pos_file /var/log/td-agent/grafana.pos
  tag software.grafana
  refresh_interval 5
  <parse>
    @type none
  </parse>
  read_from_head true
  pos_file_compaction_interval 1h
</source

Sample filters for adding additional labels:

<filter **>
  @type record_transformer
  <record>
    tag_name ${tag}
    td_host GrafanaLoki
  </record>
</filter>

<filter cloudwatch.**>
  @type record_transformer
  <record>
    group cloud
    subgroup cloudwatch
  </record>
</filter>

Sample for outputting into files, archiving, ingesting into loki

<match **>
  @type copy
  @id copy
  <store>
    @id loki
    @type loki
    url "http://grafanaloki:3100"
    extra_labels {"env":"Grafana", "host":"Grafana"}
    flush_interval 1s
    flush_at_shutdown true
    buffer_chunk_limit 1m
    <label>
      tag_name
      td_host
      group
      subgroup
      level_three
    </label>
  </store>
  <store>
    @id file
    @type file
    path /var/log/fluentd/grafana_1/${tag}/file.GrafanaLoki.%Y-%m-%d_%H:%M:00
    append true
    <buffer tag, time>
      timekey 5m
      timekey_use_utc true
      timekey_wait 1m
    </buffer>
  </store>
</match>

The above configs are pretty much self-explanatory. Using Loki, Grafana are also very easy. But most important thing, configure and use Grafana with a 3rd party login instead of just username and password. I can’t stress the importance of MFA and if possible use YubiKey Bio. Most other forms of MFA have vulnerabilities and are hackable considering the advanced capabilities of the R&AW / Mafia / Anonymous hackers group equipment.
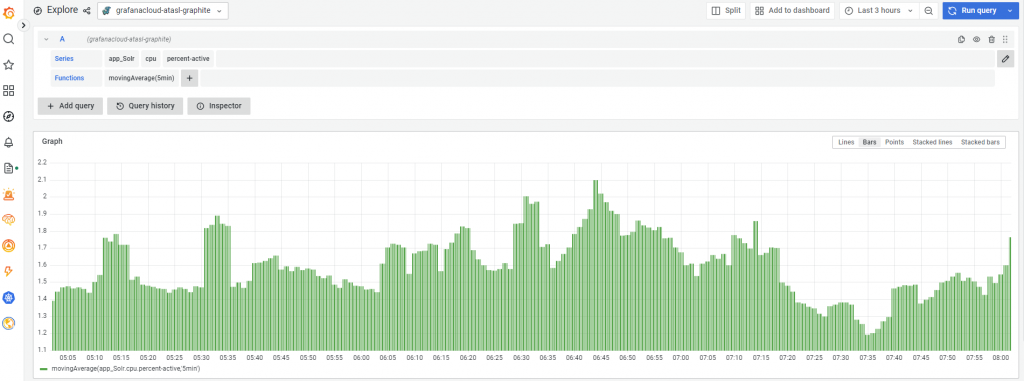
Metrics:

I am using collectd, Carbon, Grafana cloud for metrics. i.e all the servers have collectd, collectd ingests metrics into Carbon, Carbon forwards these metrics into Grafana cloud. Based upon patterns, set threshold alerts. I am planning to ingest custom additional metrics. But that’s planned for later. Definitely when I get to this phase, I would write some blog posts.

Alerts:

Considering the R&AW / Mafia / Anonymous hackers threat (capabilities of the equipment) – the most damage can happen if they login into AWS Console / SSH into servers. I have wrote some custom code for a lambda that would parse cloudwatch logs looking for AWS console login pattern and sends an alert. This Lambda runs once every minute. The anonymous hackers / spies / R&AW / Mafia might screenshot my AWS account or even record video or even might show my screen in a live video but they can’t login because of biometric MFA authentication.

Similarly I have configured my servers to send an email alert as soon as a SSH login happens. I access my Linux servers from within AWS website using EC2 Instance Connect rather than direct SSH. In other words, if anyone wants to access my Linux servers, they have to first login into AWS console using YubiKey Bio – in other words, no one else can login as of now.

I can provide code samples for the above 2 activities in a later blog post.

TimeSlices:

Earlier, I mentioned about a concept – TimeSlices. I don’t need all logs forever, if I want a certain logstream during a certain period, retain those logs.

Similarly another nice to have feature would be the ability to configure different retention periods for different types of logs. For example, remove traces after x day, remove debug after y days, remove info after z day. Retain Warn, Error, Critical for a longer period.

I am hoping this blog post helps someone. If anyone needs any help with architecting, planning, designing, developing for horizontal and vertical scalability or want any help with centralized logging or enterprise search using Solr or ElasticSearch or want to reduce costs by rightsizing, please do contact me. I offer free consultation and we can agree on the work that needs to be performed and the pricing.

–

Mr. Kanti Kalyan Arumilli

Arumilli Kanti Kalyan, Founder & CEO

B.Tech, M.B.A

Facebook

LinkedIn

Threads

Instagram

Youtube

Founder & CEO, Lead Full-Stack .Net developer

ALight Technology And Services Limited

ALight Technologies USA Inc

Youtube

Facebook

LinkedIn

Phone / SMS / WhatsApp on the following 3 numbers:

+91-789-362-6688, +1-480-347-6849, +44-07718-273-964

kantikalyan@gmail.com, kantikalyan@outlook.com, admin@alightservices.com, kantikalyan.arumilli@alightservices.com, KArumilli2020@student.hult.edu, KantiKArumilli@outlook.com and 3 more rarely used email addresses – hardly once or twice a year.

Categories
Welcome

How to mount EFS on EC2 Ubuntu instances and automount on reboot

EFS stands for Elastic File System. EFS is a network filesystem where data can persistent and can be accessed by several different EC2 instances.

In pursuit of having my own crash-resistant, tamper-proof, immutable logs and any other future sensitive information I wanted to leverage EFS in my startup ALight Technology And Services Limited.

This article does not discuss EFS in-depth i.e throughput types, Standard vs One Zone etc.. This article is simply about how to mount and automatically mount.

  1. Create the EFS in the region where you need. My current datacenter is in London, United Kingdom because my company is registered in London, United Kingdom (Once again my sincere respect and gratitude for the Government of United Kingdom)
  2. In your EC2 security groups allow port 2049, attach the EC2’s security groups in the networking section of the EFS.
  3. Install the required software
sudo apt install nfs-common -y && \
    sudo systemctl status nfs-utils

4. The command for mounting can be found in EFS, click the EFS name, click “Attach” and you can get the instructions:

sudo mount -t nfs4 -o nfsvers=4.1,rsize=1048576,wsize=1048576,hard,timeo=600,retrans=2,noresvport <FS_ID>.efs.aws-region.amazonaws.com:/ <YOUR_MOUNT_POINT>

5. Copy some file

6. Edit /etc/fstab and add the following line

file_system_id.efs.aws-region.amazonaws.com:/ mount_point nfs4 nfsvers=4.1,rsize=1048576,wsize=1048576,hard,timeo=600,retrans=2,noresvport,_netdev 0 0

Update the above bolded text as per your configuration.

7. Reboot

8. See if the filesystem got attached

Reference List

Mounting on Amazon EC2 Linux instances using the EFS mount helper – Amazon Elastic File System (no date). Available at: https://docs.aws.amazon.com/efs/latest/ug/mounting-fs-mount-helper-ec2-linux.html (Accessed: February 1, 2023).

Using NFS to automatically mount EFS file systems – Amazon Elastic File System (no date). Available at: https://docs.aws.amazon.com/efs/latest/ug/nfs-automount-efs.html (Accessed: February 1, 2023).

Categories
ElasticSearch ELK Logging

Some log management tips

Recently, I have been writing on log management tools and techniques. Very recently, I am even evaluating Grafana Loki on-premise. I would write a review in few days regarding Grafana Loki. As of now from server hardware requirements, log volume ingestion standpoint Grafana seems excellent compared with ELK stack and GrayLog.

This blog post is a general blog post. For proper log management, we need different components.

  1. Log ingestion client
  2. Log ingestion server
  3. Log Viewer
  4. Some kind of long-term archiver that can restore certain logs on required basis (Optional)

Log Ingestion Client:

FluentD is the best log ingestion client for several reasons. Every log ingestion stack have their own log ingestion clients. ELK Stack has LogBeats, MetricBeats etc… GrayLog does not have a client of its own but supports log ingestion via Gelf / RSysLog etc… Grafana Loki has PromTail.

FluentD can collect logs from various sources and ingest into various destinations. Here is the best part – multiple destinations based on rules. For example certain logs can be ingested into Log servers and uploaded to S3. Very easy to configure and customize and there are plenty of plugins for sources, destinations and even customizing logs such as adding tags, extracting values etc… Here is a list of plugins.

FluentD can ingest into Grafana Loki, ELK stack, GrayLog and much more. If you use FluentD, if the target needs to be changed, its just a matter of configuration.

Log Ingestion Server:

ELK vs GrayLog vs Grafana Loki vs Seq and several others. As of now, I have evaluated ELK, GrayLog and Grafana Loki.

Log Viewer:

Grafana front end with Loki backend, GrayLog, Kibana frontend with ElasticSearch backend in ELK stack.

Long-Term Archiving:

ELK stack has lifecycle rules for backing up and restoring. GrayLog can be configured to close indexes and re-open on a necessary basis. Grafana Loki has retention and compactor settings. However, I have not figured out how to re-open compacted gz files on a necessity basis.

Apart from these, I am using Graphite for metrics. I do have plans for ingesting additional metrics. As of now, I am using the excellent hosted solution provided by Grafana. As of now, in the near-term I don’t have plans for self-hosting metrics. But Grafana front-end supports several data sources.

I am thinking of collecting certain extra metrics without overloading the application (might be an after-thought or might not be). I am collecting NGinx logs in json format. The URL, upstream connect, upstream response time are being logged. Now, by parsing these logs, the name of the ASP.Net MVC controller, name of the Action Method, the HTTP verb can be captured. Now, I can use these as metrics. I can very easily add metrics at the database layer in the application. With these metrics, I can easily identify bottlenecks, slow performing methods and even monitor average response times etc… and set alerts.

The next few days or weeks would be about the custom metric collection based on logs. You can expect few blog posts on some FluentD configuration, C# code etc… FluentD does have some plugins for collecting certain metrics but we will look into some C# code for parsing, sending metrics into Graphite.

Here is a screenshot from the self-hosted Grafana front-end for Loki logs:

Grafana showing Loki logs for PodDB

Here is a screenshot from Grafana.com hosted showing Graphite metrics

Graphite Solr Backend Server CPU usage

I am hoping this blog posts helps someone. Some C# code for working with Logs, Metrics and Graphite over the next few days / weeks.

–

Mr. Kanti Kalyan Arumilli

Arumilli Kanti Kalyan, Founder & CEO

B.Tech, M.B.A

Facebook

LinkedIn

Threads

Instagram

Youtube

Founder & CEO, Lead Full-Stack .Net developer

ALight Technology And Services Limited

ALight Technologies USA Inc

Youtube

Facebook

LinkedIn

Phone / SMS / WhatsApp on the following 3 numbers:

+91-789-362-6688, +1-480-347-6849, +44-07718-273-964

kantikalyan@gmail.com, kantikalyan@outlook.com, admin@alightservices.com, kantikalyan.arumilli@alightservices.com, KArumilli2020@student.hult.edu, KantiKArumilli@outlook.com and 3 more rarely used email addresses – hardly once or twice a year.

Categories
.Net C# Logging NLog

NLog FallbackGroup Target

In the past I have written few blog posts on NLog and discussed several techniques:

Programatically configuring NLog in C#

NLog in .Net Applications

Some NLog configuration examples for writing into different log management systems

How to log debug level logs only when an exception occurs in ASP.Net using NLog

And I have discussed about a possibility of capturing more information in logs only when needed such as in the case of errors or exceptions in the following blog post:

An abnormal way of logging – open for discussion

My use-case explanation:

I am planning to use Gelf logging for easier compatibility reasons. Gelf logs can be ingested into pretty much every major centralized logging platforms such as: Kibana, GrayLog, Seq, Grafana. Some would require some intermediary software to accept Gelf formatted logs and some can directly ingest Gelf formatted logs. However, for various reasons, sometimes the logging server might not be available, specifically when the log ingestors are not in a cluster. Log files can be easily ingested into the above mentioned centralized logging agents using different sofware.

Based on the above use-case I wanted to use Gelf for directly logging into the centralized logging server and as a failover, I want to write the logs to a file that would get ingested at a later point by some other software.

Now, by combing the previous post example, we can achieve AspNetBuffering and ingest different levels of logs only when errors occur. The code samples should be very easy to understand.

Read the How to log debug level logs only when an exception occurs in ASP.Net using NLog prior to continuing.

<extensions>
    <add assembly="NLog.Web.AspNetCore"/>
    <add assembly="NLog.Targets.Gelf"/>
</extensions>

<targets>
    <target xsi:type="AspNetBufferingWrapper" name="aspnetbuffer" bufferGrowLimit="100000" growBufferAsNeeded="true">
        <target xsi:type="PostFilteringWrapper" defaultFilter="level &gt;= LogLevel.Info">
            <target xsi:type="FallbackGroup" returnToFirstOnSuccess="true">
                <target xsi:type="gelf" endpoint="tcp://logs.local:12201" facility="console-runner" sendLastFormatParameter="true">
                    <parameter name="param1" layout="${longdate}"/>
                    <parameter name="param2" layout="${callsite}"/>
                 </target>
		<target xsi:type="File" fileName="c:\temp\nlog-AspNetCore-all-${shortdate}.log" layout="${longdate}|${event-properties:item=EventId:whenEmpty=0}|${level:uppercase=true}|${logger}|${message} ${exception:format=tostring}" />
              </target>
              <when exists="level &gt;= LogLevel.Warn" filter="level &gt;= LogLevel.Debug"/>
       </target>
    </target>
</targets>

<rules>
    <logger name="*" minlevel="Debug" writeTo="aspnetbuffer" />
</rules>

In the above code we have wrapped Gelf logger, File logger inside a FallBackGroup logger. The FallBackGroup logger is wrapped inside a PostFilteringWrapper. The PostFilteringWrapper is wrapped inside a AspNetBufferingWrapper.

In the above code in the <rules> section we are sending all Debug and above logs to the AspNetBufferingWrapper.

Now AspNetBufferingWrapper buffers the log messages for an entire request, response cycle and sends the log messages to the PostFilteringWrapper.

The PostFilteringWrapper sees if there are any Warnings or above loglevel, if yes sends all the messages that have Debug and above loglevels. Else sends Info and above messages. The target of PostFilteringWrapper is the FallbackGroup logger which receives these messages.

The FallBackGroup logger attempts to use the Gelf logger, if the Gelf logger is unable to process the messages, the logs are sent to the File logger.

–

Mr. Kanti Kalyan Arumilli

Arumilli Kanti Kalyan, Founder & CEO

B.Tech, M.B.A

Facebook

LinkedIn

Threads

Instagram

Youtube

Founder & CEO, Lead Full-Stack .Net developer

ALight Technology And Services Limited

ALight Technologies USA Inc

Youtube

Facebook

LinkedIn

Phone / SMS / WhatsApp on the following 3 numbers:

+91-789-362-6688, +1-480-347-6849, +44-07718-273-964

kantikalyan@gmail.com, kantikalyan@outlook.com, admin@alightservices.com, kantikalyan.arumilli@alightservices.com, KArumilli2020@student.hult.edu, KantiKArumilli@outlook.com and 3 more rarely used email addresses – hardly once or twice a year.

Categories
.Net C# Logging NLog

How to log debug level logs only when an exception occurs in ASP.Net using NLog

In the past I have written few blog posts on NLog and discussed several techniques:

Programatically configuring NLog in C#

NLog in .Net Applications

Some NLog configuration examples for writing into different log management systems

And I have discussed about a possibility of capturing more information in logs only when needed such as in the case of errors or exceptions in the following blog post:

An abnormal way of logging – open for discussion

This blog post is for Asp.Net Core only.

This should be possible by combining AspNetBufferingWrapper and PostFilteringWrapper.

Sample configuration provided below:

AspNetBufferingWrapper:

AspNetBufferingWrapper buffers all the messages in a ASP.Net request and sends all the messages to the wrapped target.

Remember to set this logger properly. This involves:

  1. Adding the NLog.Web.AspNetCore nuget package
  2. Properly configuring nlog.config file
  3. Registering the middleware
dotnet add package NLog.Web.AspNetCore --version 5.2.1
<extensions>
    <add assembly="NLog.Web.AspNetCore"/>
</extensions>
using NLog.Web;

app.UseMiddleware<NLogBufferingTargetWrapperMiddleware>();

PostFilteringWrapper:

This wrapper evaluates a specified condition and filters logs, then sends the logs to the wrapped target:

<target xsi:type="PostFilteringWrapper" defaultFilter="level &gt;= LogLevel.Info">
    <target .... />
    <when exists="level &gt;= LogLevel.Warn" filter="level &gt;= LogLevel.Debug"/>
</target>

The above configuration by default logs Info and above logs, but if there is a Warn or higher, logs debug or higher. For this to work properly obviously this logger has to receive Debug messages otherwise there is no point in using this logger.

Now combing these two loggers, here is an example:

<extensions>
    <add assembly="NLog.Web.AspNetCore"/>
</extensions>

<targets>
    <target xsi:type="AspNetBufferingWrapper" name="aspnetbuffer" bufferGrowLimit="1000" growBufferAsNeeded="true">
        <target xsi:type="PostFilteringWrapper" defaultFilter="level &gt;= LogLevel.Info">
            <target xsi:type="File" fileName="c:\temp\nlog-AspNetCore-all-${shortdate}.log"
 layout="${longdate}|${event-properties:item=EventId:whenEmpty=0}|${level:uppercase=true}|${logger}|${message} ${exception:format=tostring}" />
        <when exists="level &gt;= LogLevel.Warn" filter="level &gt;= LogLevel.Debug"/>
        </target>
    </target>
</targets>

<rules>
    <logger name="*" minlevel="Debug" writeTo="aspnetbuffer" />
</rules>

Hoping this post helps someone!

Happy development.

–

Mr. Kanti Kalyan Arumilli

Arumilli Kanti Kalyan, Founder & CEO

B.Tech, M.B.A

Facebook

LinkedIn

Threads

Instagram

Youtube

Founder & CEO, Lead Full-Stack .Net developer

ALight Technology And Services Limited

ALight Technologies USA Inc

Youtube

Facebook

LinkedIn

Phone / SMS / WhatsApp on the following 3 numbers:

+91-789-362-6688, +1-480-347-6849, +44-07718-273-964

kantikalyan@gmail.com, kantikalyan@outlook.com, admin@alightservices.com, kantikalyan.arumilli@alightservices.com, KArumilli2020@student.hult.edu, KantiKArumilli@outlook.com and 3 more rarely used email addresses – hardly once or twice a year.

Categories
Logging

Some centralized logging tools

I have evaluated few different centralized logging tools, specifically the following:

  1. Grafana Loki
  2. Kibana
  3. Graylog
  4. Seq

In the short-term, I am using Graylog, but in the next few years, I might choose a different option.

The key features I have been looking for are:

  1. Lower hardware requirements – for a small startup without any revenue yet, I didn’t want to spend too much.
  2. Customizable retention period of logs
  3. Being able to backup logs to some cheaper storage such as S3 rather than having 100’s of GB on EBS volumes.
  4. Easily able to restore a smaller portion of logs for a certain period and be able to search.
  5. Being able to ingest various types of logs

Let me explain my personal requirements clearly.

I want to ingest all the logs from all possible sources i.e system logs, software logs such as web server, mysql audit logs, custom application logs. Currently my applications and servers are generating approximately 800Mb of logs per day. That would be about 25Gb per month and 300Gb per year. I want to retain logs for a longer period in archives for various reasons. I currently don’t have any products that need to meet compliance requirements. I arbitrarily choose 400 days worth of log retention and the logs need to be immutable. Once the logs are ingested, the logs need to be stored for 400 days and should not be modified. The reason being in the future if I need to meet compliance requirements, it would be easy to change the retention period and the integrity of the logs can be verified.

I have personally evaluated the following:

  1. Grafana Loki hosted at https://www.grafana.com.
  2. Self-Hosted ELK stack
  3. Self-Hosted Open Source version of Graylog
  4. AWS Cloudwatch

I have read about but have not evaluated the following yet:

  1. Self-Hosted Seq
  2. Self-Hosted Grafana Loki

Given the above I will tell you the advantages and disadvantages of each solution.

Grafana Loki hosted:

Grafana has a very generous free tier with 50Gb log ingestion and 14 days retention. The paid customized plans pricing was not clear. Considering the logs are hosted by a 3rd party, I would hope they would introduce some additional security measures such as allowing log ingestion from only certain IP’s etc… Even if the API keys are stolen or spied upon, the hackers cannot pollute the log data.

Self-Hosted ELK stack:

This is one very great solution but the setup and versions compatibility is very problematic. Self-Hosted ELK stack is a little heavy on resources. But definitely worth for SME’s who have the budget for the required hardware and few Server Admin professionals on team. As of now, because of the R&AW harassment, impersonation, I don’t know when I would launch commercial products. And these are recurring expenses, not one time expenses, so I am trying to set myself for success with smaller monthly server expenses. I wish these psycho human rights violators get arrested. There are ways to export backups into S3, almost a perfect solution

GrayLog OpenSource:

GrayLog is a bit heavy on system resources but requires lesser resources compared with ELK stack. Indexes can be closed but backing up and restoring are not directly part of the application. Probably part of the GrayLog paid version.

AWS CloudWatch:

AWS Cloudwatch is perfect if there is a need for compliance with retention policies and immutability. CloudWatch logs can be exported into S3 buckets. S3 buckets can be configured to be immutable for compliance reasons and S3 lifecycle policies can be defined for removal of data etc… But querying data is a little problematic compared with the ease of other solutions.

Seq:

Seq has a free version, seemed to be light-weight. Very easy to write extensions using C# (My primary development language). There is no direct plugin for for exporting data into S3 but a customizable plugin might be possible. There are plugins for writing into an Archive file. The Archive file can be exported to S3 periodically. Trying on localhost is very easy – pull a docker image and run the docker image. No complicated setup.

Self-hosted Grafana Loki:

I think pretty much all the capabilities of hosted Grafana Loki might be possible. However, I haven’t tried yet.

In all the above solutions, logs could be tampered by hackers except with AWS Cloudwatch. Once ingested, the logs stay there un-tampered. If Admin’s account gets hacked, the retention period can be changed or log streams might be deleted, but cannot be tampered.

As of now, I have not yet found the perfect solution for my requirements, but I am hoping this blog post helps some people in deciding between various different centralized logging solutions based upon your own requirements.

–

Mr. Kanti Kalyan Arumilli

Arumilli Kanti Kalyan, Founder & CEO

B.Tech, M.B.A

Facebook

LinkedIn

Threads

Instagram

Youtube

Founder & CEO, Lead Full-Stack .Net developer

ALight Technology And Services Limited

ALight Technologies USA Inc

Youtube

Facebook

LinkedIn

Phone / SMS / WhatsApp on the following 3 numbers:

+91-789-362-6688, +1-480-347-6849, +44-07718-273-964

kantikalyan@gmail.com, kantikalyan@outlook.com, admin@alightservices.com, kantikalyan.arumilli@alightservices.com, KArumilli2020@student.hult.edu, KantiKArumilli@outlook.com and 3 more rarely used email addresses – hardly once or twice a year.

Categories
AWS

Private Hosted Zone in Route 53 on AWS

Cross Post – https://kantikalyan.medium.com/private-hosted-zone-in-route-53-on-aws-3b31975b6fb1

Although ALight Technology And Services Limited is a very small startup as of now but internally there are few different servers hosted on AWS. I had the need for a private DNS server. This blog post is about setting up a Private Hosted Zone in Route 53 on AWS.

*Hosted Zones cost $0.5 per month and additional for the DNS queries but worth instead of going through the trouble of setting up own DNS servers on few different EC2 instances (alternate and slightly cheaper way, but not very reliable and lots of sysadmin work).

Here are the steps:

  1. Go to Route 53 and create a new Hosted Zone with the Type – Private Hosted Zone option.
  2. Associate the necessary VPC’s, be careful not to have overlapping addresses. The VPV’s need to have DNS Hostnames and DNS Resolution enabled.
  3. Now log in into your EC2 instance and do a nslookup.
> nslookup my.local //Assuming you have setup a record as my.local in Route 53.

If you get the IP resolved great! If not, use this webpage for troubleshooting – https://aws.amazon.com/premiumsupport/knowledge-center/route-53-fix-dns-resolution-private-zone/

For me the 4th part solved my error – Review custom settings in resolv.conf.

Hoping the above blog post helps someone.

Although, I have AWS Certified Architect Certificate and do have knowledge of AWS Route 53 Private Hosted Zone, this effort has allowed me to gain hands-on experience!

Happy development :)!

–

Mr. Kanti Kalyan Arumilli

Arumilli Kanti Kalyan, Founder & CEO

B.Tech, M.B.A

Facebook

LinkedIn

Threads

Instagram

Youtube

Founder & CEO, Lead Full-Stack .Net developer

ALight Technology And Services Limited

ALight Technologies USA Inc

Youtube

Facebook

LinkedIn

Phone / SMS / WhatsApp on the following 3 numbers:

+91-789-362-6688, +1-480-347-6849, +44-07718-273-964

kantikalyan@gmail.com, kantikalyan@outlook.com, admin@alightservices.com, kantikalyan.arumilli@alightservices.com, KArumilli2020@student.hult.edu, KantiKArumilli@outlook.com and 3 more rarely used email addresses – hardly once or twice a year.

Categories
.Net AWS C#

How to export logs from cloudwatch to S3.

There might be a business case for log retention whether it’s for compliance or any other reason.

This is the approach being used by ALight Technology And Services Limited for longer term log retention.

I have created a bucket in S3 with the following retention policies:

AWS S3 Object Lock Policy

I personally don’t have to follow compliance yet, but nothing wrong in implementing compliance policies.

I have also defined a life-cycle policy to transition objects into Standard-IA (Infrequent Access) after 30 days.

Now I am developing a Lambda that would create Export tasks in CloudWatch once a week.

Here are some relevant C# code snippets:

var _client = new AmazonCloudWatchLogsClient(RegionEndpoint.EUWest2);
// Initialized AmazonCloudWatchLogsClient

var response = await _client.DescribeLogGroupsAsync();
// Get a list of LogGroups

foreach(var logGroup in response.LogGroups)
{
    var prefix = $"{from}-{to}-{logGroup.LogGroupName}";
    // You can define your own prefix
   
    var exportResult = await _client.CreateExportTaskAsync(new
        CreateExportTaskRequest
{
            Destination = "<NAME_OF_S3_BUCKET>",
            DestinationPrefix = prefix,
            From = GetUnixMilliSeconds(from),
            LogGroupName = logGroup.LogGroupName,
            TaskName = prefix,
            To = GetUnixMilliSeconds(to),
        })
    };

The above code is pretty much self-explantory. Here is a code snippet for getting Unix MilliSeconds from epoch.

long GetUnixMilliSeconds(DateTime dateTime)
{
    var _epoch = new DateTime(1970, 1, 1, 0, 0, 0, 0);
    return (dateTime.Ticks - _epoch.Ticks) / 10000;
}

Happy development!

Stay away from psycoSpies!

–

Mr. Kanti Kalyan Arumilli

Arumilli Kanti Kalyan, Founder & CEO

B.Tech, M.B.A

Facebook

LinkedIn

Threads

Instagram

Youtube

Founder & CEO, Lead Full-Stack .Net developer

ALight Technology And Services Limited

ALight Technologies USA Inc

Youtube

Facebook

LinkedIn

Phone / SMS / WhatsApp on the following 3 numbers:

+91-789-362-6688, +1-480-347-6849, +44-07718-273-964

kantikalyan@gmail.com, kantikalyan@outlook.com, admin@alightservices.com, kantikalyan.arumilli@alightservices.com, KArumilli2020@student.hult.edu, KantiKArumilli@outlook.com and 3 more rarely used email addresses – hardly once or twice a year.

Categories
.Net C# Security

C# code for reading sensitive information from Console

I had a need to generate random passwords and / keys and update various config files. For example, keys and passwords used by log ingesting utilities such as FileBeat, PromTail, MetricBeat etc…

In earlier blog posts, I have mentioned, that at this point log ingestion, retention and major alerts implementation is complete. So, obviously the next part is securing the keys.

I know the hacker spies – India’s psychopath R&AW spies can and are seeing any plain-text items on screen and if I am not wrong, they might have even hacked into my accounts several times. Yes, they say they are investigation teams etc… bull-shit but in reality they are corrupted and are the criminals i.e greedy investigators / spies who did crime and are trying to get away from crime.

Anyway, because I know how the “prying eyes” equipment works, I need to defend myself from the hacker spies as much as possible. For more info about this scam: https://www.simplepro.site.

Here is a small C# code snippet for reading from console without echoing back:

string GetSensitiveText()
{
    StringBuilder password = new StringBuilder();
    ConsoleKeyInfo keyInfo = Console.ReadKey(true);

    while (keyInfo.Key != ConsoleKey.Enter)
    {
        password.Append(keyInfo.KeyChar);

        keyInfo = Console.ReadKey(true);
    }

    return password.ToString();
}

Now everyone knows how to do open a file, read content and replace content. A simple program can be developed that would take the path of config file, old value, new value and replace.

i.e for example during test, alpha modes if a key is “KEY” and then later if you use a random password generator that would generate password and copy into memory, this type of small tool can help with replacing “KEY” with the “RAND0M P@$$W0rd”.

Some code sample:

Console.WriteLine("Enter filepath:");
var fileName = Console.ReadLine();
var sr = new StreamReader(fileName);
var content = sr.ReadToEnd();
sr.Close();
Console.WriteLine("Enter Search Phrase:");
var searchPhrase = Console.ReadLine();
var matchedIndex = content.IndexOf(searchPhrase);
if(matchedIndex >= 0)
{
    Console.WriteLine("Match found.");
    Console.WriteLine("Enter replacement text:");
    var replacementText = GetSensitiveText();

    var sw = new StreamWriter(fileName);
    sw.Write(content.Replace(searchPhrase, replacementText));
    sw.Flush();
    sw.Close();
}

We prompt for the path to the config file, prompt for the search text. If the search text is found, we prompt for the secret i.e the replace text. But, we don’t echo the new sensitive info to the Console. Then the search text is replaced with new sensitive info and then we write the contents back to the file.

Happy secure coding! 🙂

–

Mr. Kanti Kalyan Arumilli

Arumilli Kanti Kalyan, Founder & CEO

B.Tech, M.B.A

Facebook

LinkedIn

Threads

Instagram

Youtube

Founder & CEO, Lead Full-Stack .Net developer

ALight Technology And Services Limited

ALight Technologies USA Inc

Youtube

Facebook

LinkedIn

Phone / SMS / WhatsApp on the following 3 numbers:

+91-789-362-6688, +1-480-347-6849, +44-07718-273-964

kantikalyan@gmail.com, kantikalyan@outlook.com, admin@alightservices.com, kantikalyan.arumilli@alightservices.com, KArumilli2020@student.hult.edu, KantiKArumilli@outlook.com and 3 more rarely used email addresses – hardly once or twice a year.

Categories
Logging

Ingesting logs into GrayLog

Graylog is a logs only software, very easy to configure and use. There are several nice features, few of the features I liked:

  1. Easy to setup alerts
  2. Easy to setup processing rules and pipelines
  3. Lighter on system resources
  4. Flexible ways of ingesting logs

Like ELK stack, GrayLog can be easily installed, secured for ingesting logs. ELK stack has manageable ElasticAgents i.e client software running on different systems and the client software can be managed from the web interface. ELK stack has support for metrics, GrayLog does not. GrayLog is for logs only and does well.

Installing and configuring GrayLog consists of installing 3 software:

  1. MongoDB
  2. ElasticSearch
  3. GrayLog

The instructions are very easy to follow and are located in GrayLog’s documentation can be accessed by clicking the appropriate link at: https://www.graylog.org/downloads/.

Some of my favorite Inputs are:

  1. RSysLog
  2. Beats
  3. Beats

–

Mr. Kanti Kalyan Arumilli

Arumilli Kanti Kalyan, Founder & CEO

B.Tech, M.B.A

Facebook

LinkedIn

Threads

Instagram

Youtube

Founder & CEO, Lead Full-Stack .Net developer

ALight Technology And Services Limited

ALight Technologies USA Inc

Youtube

Facebook

LinkedIn

Phone / SMS / WhatsApp on the following 3 numbers:

+91-789-362-6688, +1-480-347-6849, +44-07718-273-964

kantikalyan@gmail.com, kantikalyan@outlook.com, admin@alightservices.com, kantikalyan.arumilli@alightservices.com, KArumilli2020@student.hult.edu, KantiKArumilli@outlook.com and 3 more rarely used email addresses – hardly once or twice a year.