Recently, I have been writing on log management tools and techniques. Very recently, I am even evaluating Grafana Loki on-premise. I would write a review in few days regarding Grafana Loki. As of now from server hardware requirements, log volume ingestion standpoint Grafana seems excellent compared with ELK stack and GrayLog.
This blog post is a general blog post. For proper log management, we need different components.
- Log ingestion client
- Log ingestion server
- Log Viewer
- Some kind of long-term archiver that can restore certain logs on required basis (Optional)
Log Ingestion Client:
FluentD is the best log ingestion client for several reasons. Every log ingestion stack have their own log ingestion clients. ELK Stack has LogBeats, MetricBeats etc… GrayLog does not have a client of its own but supports log ingestion via Gelf / RSysLog etc… Grafana Loki has PromTail.
FluentD can collect logs from various sources and ingest into various destinations. Here is the best part – multiple destinations based on rules. For example certain logs can be ingested into Log servers and uploaded to S3. Very easy to configure and customize and there are plenty of plugins for sources, destinations and even customizing logs such as adding tags, extracting values etc… Here is a list of plugins.
FluentD can ingest into Grafana Loki, ELK stack, GrayLog and much more. If you use FluentD, if the target needs to be changed, its just a matter of configuration.
Log Ingestion Server:
ELK vs GrayLog vs Grafana Loki vs Seq and several others. As of now, I have evaluated ELK, GrayLog and Grafana Loki.
Log Viewer:
Grafana front end with Loki backend, GrayLog, Kibana frontend with ElasticSearch backend in ELK stack.
Long-Term Archiving:
ELK stack has lifecycle rules for backing up and restoring. GrayLog can be configured to close indexes and re-open on a necessary basis. Grafana Loki has retention and compactor settings. However, I have not figured out how to re-open compacted gz files on a necessity basis.
Apart from these, I am using Graphite for metrics. I do have plans for ingesting additional metrics. As of now, I am using the excellent hosted solution provided by Grafana. As of now, in the near-term I don’t have plans for self-hosting metrics. But Grafana front-end supports several data sources.
I am thinking of collecting certain extra metrics without overloading the application (might be an after-thought or might not be). I am collecting NGinx logs in json format. The URL, upstream connect, upstream response time are being logged. Now, by parsing these logs, the name of the ASP.Net MVC controller, name of the Action Method, the HTTP verb can be captured. Now, I can use these as metrics. I can very easily add metrics at the database layer in the application. With these metrics, I can easily identify bottlenecks, slow performing methods and even monitor average response times etc… and set alerts.
The next few days or weeks would be about the custom metric collection based on logs. You can expect few blog posts on some FluentD configuration, C# code etc… FluentD does have some plugins for collecting certain metrics but we will look into some C# code for parsing, sending metrics into Graphite.
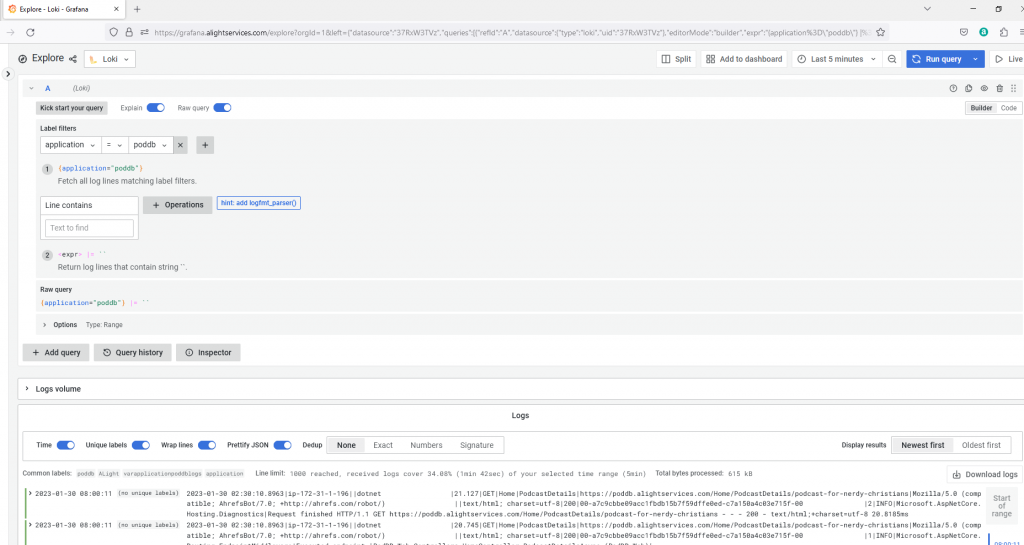
Here is a screenshot from the self-hosted Grafana front-end for Loki logs:

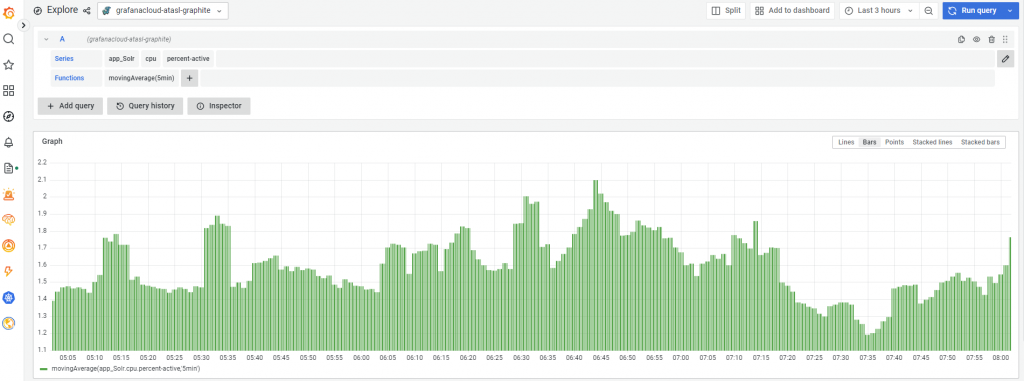
Here is a screenshot from Grafana.com hosted showing Graphite metrics

I am hoping this blog posts helps someone. Some C# code for working with Logs, Metrics and Graphite over the next few days / weeks.
–
Mr. Kanti Kalyan Arumilli

B.Tech, M.B.A
Founder & CEO, Lead Full-Stack .Net developer
ALight Technology And Services Limited
Phone / SMS / WhatsApp on the following 3 numbers:
+91-789-362-6688, +1-480-347-6849, +44-07718-273-964
kantikalyan@gmail.com, kantikalyan@outlook.com, admin@alightservices.com, kantikalyan.arumilli@alightservices.com, KArumilli2020@student.hult.edu, KantiKArumilli@outlook.com and 3 more rarely used email addresses – hardly once or twice a year.

