Most of you know I like sharing my knowledge. Here are some simple but very useful DOM manipulation functions in Javascript.
As part of development for WebSearch, I wanted leaner Javascript and for some part of the development, I am using direct Javascript rather than libraries such as jQuery. jQuery has these functionality and allows easier development. My situation and necessity are a bit different.
var ele = document.getElementById("elementid");
// for getting a reference to an existing element in the DOM

var dv = document.createElement("div");
// for creating a in-memory element.

parentEle.appendChild(childEle);
// for adding an element as a child element of another element

ele.id = "elementId";
// Setting id of element

ele.classList.add("cssClass");
ele.classList.remove("cssClass");
// Adding and removing css classes

ele.innerText = "Text";
ele.innerHTML = "<>...M/>";
// Setting text and innerHTML
// caution with innerHTML - don't inject unsafe/unvalidated markup

ele.addEventListener("event", (ev) => {
   // Anonymous function
});
// Handle events such as click etc...

ele.addEventListener("event", fnEventHandler);
// Handle events by using a function - fnEventHandler
There are various solutions for collecting, storing and viewing metrics. This blog post is specifically about the following list of software:
CollectD – For collecting system metrics
Carbon-Relay-ng – Like a server but forwards the metrics into Graphite
Hosted Graphite at Grafana.com – The backend that stores the metrics
Grafana – For viewing metrics
Grafana for alerts
Collectd
Collectd is a very light-weight, low memory, low CPU usage Linux tool that runs as a service and can collect various system related metrics. Collectd is very extensible and has several plugins. Some of the plugins, I like and have used are:
Apache web server – Gathers Apache related stats
ConnTrack – Number of connections in Linux connection tracking table
ContextSwitch – Number of context switches
CPU
DNS
IP-Tables
Load
MySQL
Processes
tcpconns
users
vmem
My favorite output plugins and some I am familiar with are:
CSV
Write Graphite
gRPC
Carbon-relay-ng
This is not necessarily my favorite, because little heavy on system resources 🙁
Now host Carbon-relay-ng on one of the servers, Install Collectd on the servers that need to ingest metrics. Use Collectd’s Write_Graphite for ingesting metrics into Carbon-relay-ng. Configure Carbon-relay-ng to ingest metrics into hosted Graphite on Grafana.com.
For ingesting any code-based metrics use ahd.Graphite.
var client = new CarbonClient("example.com");

var datapoints = new[]
    {
        new Datapoint("data.server1.cpuUsage", 10, DateTime.Now),
        new Datapoint("data.server2.cpuUsage", 15, DateTime.Now),
        new Datapoint("data.server3.cpuUsage", 20, DateTime.Now),
    };

await client.SendAsync(datapoints);

//Sample code from - https://github.com/ahdde/graphite.net
I would say instead of instantiating too many instances, use either singleton or use a very small pool of instances.
I have promised to semi-open-source some code from my upcoming project – Alerts in the anouncements blog. Anyone with some programming knowledge, can implement such a solution by following this blog. This would be implemented slowly because I am planning to get normal 9 – 5 job, instead of joining or participating in the r&aw dawgs human rights violation, game of loans, game of identity distortion (in this case, I am the victim and their offer, if I participate – identity distortion of some American – sorry, I am not a psycho)
Moreover, for at least 6 – 12 months, the project would be offered completely free of charge for some companies / individuals who see a need and can provide feedback.
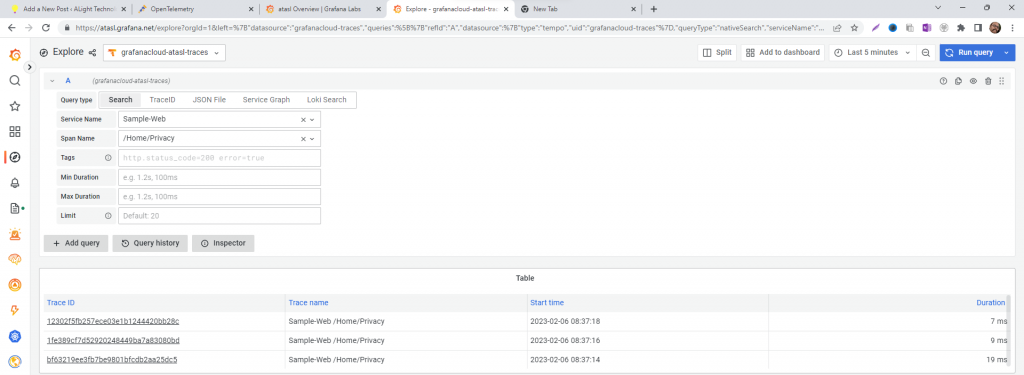
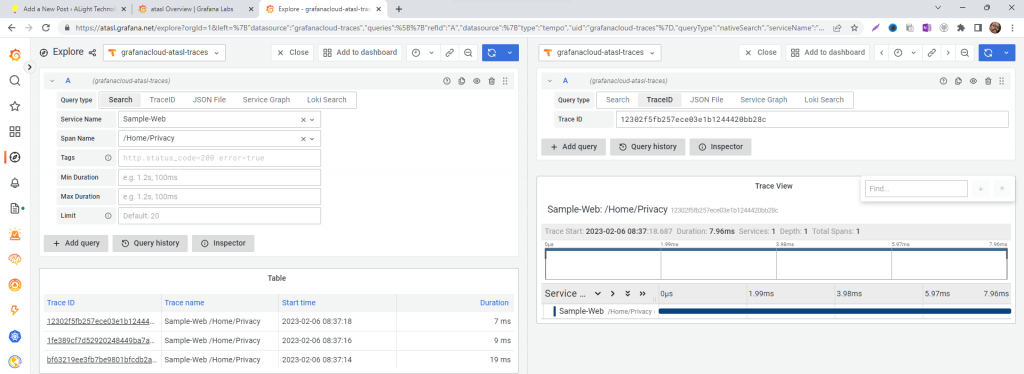
OpenTelemetry is pretty much like logs and metrics with distinguishable TraceId’s.
Yesterday and this morning I have experimented with OpenTelemetry in a sample ASP.Net MVC application.
The Primary components are:
A host for Tempo – using Grafana hosted Tempo – https://www.grafana.com. Grafana has a very generous 100GB traces per month in the free tier.
Grafana Agent – As of now, I have used Grafana Agent on Windows laptop, have not configured on Linux production servers yet. Grafana Agent can be downloaded from here. Click on the releases in the right side and choose the Operating System. Here is the link for v0.31.0.
Add the following pre-release dll’s to your ASP.Net MVC application.
“OnLINE Erra, Thota terrorist bastards are spy bastards, they don’t command me, I do whatever I like, because they use invisible spying drone they try to frame me“
This blog post is a general blog post on how centralized logging has been implemented, some of the tools used while keeping the costs low.
Having the ability to maintain logs is very important for software companies, even small startups. Centralized logging, monitoring, metrics and alerts are also important.
Log ingestion is done using FluentD. FluentD is installed on all the servers and even a Golden Base AMI has been created with FluentD installed.
Grafana Loki is used as the log ingestion server.
Grafana front-end for viewing logs from Loki.
FluentD has been configured to set different labels for different log sources, the output is written into Loki and into file output.
The output files would be zipped and uploaded into S3 with lifecycle policies. S3 buckets can be configured to be immutable i.e once a file is uploaded, can’t be deleted or re-written or modified until a specified period.
Loki has been configured with a smaller retention period. I wish Grafana Loki supported something like retaining time slices. More on the concept of time slices later in this blog post.
Loki can be configured for a longer retention period but unnecessary EBS storage costs. S3 Standard Infrequent Access or S3 Glacier Instant Retrieval are much cheaper for archival data. Based on your needs you can configure the system.
A new component in C# is being developed to ingest logs into Loki on a need basis. I will definitely post some sample code of the new component.
With the above configuration in place, once logs are written and within 6 minutes, the logs become immutable. Let’s say something happened, and was noticed within 1 day. I can immediately change the retention period of Loki and keep the log retention for longer period. If I saw some abnormality and if the logs are no longer available in Loki due to shorter retention period. The new component being developed would ingest the archived logs from S3 into Loki with the old timestamps. Under normal circumstances this wouldn’t be required, but there is no point in having archived logs that cannot be ingested and searched when required.
Some sample config elements for FluentD:
Code block for ingesting logs from CloudWatch:
I am ingesting CloudTrail logs, I would write a blog post or a video sometime later.
The above configs are pretty much self-explanatory. Using Loki, Grafana are also very easy. But most important thing, configure and use Grafana with a 3rd party login instead of just username and password. I can’t stress the importance of MFA and if possible use YubiKey Bio. Most other forms of MFA have vulnerabilities and are hackable considering the advanced capabilities of the R&AW / Mafia / Anonymous hackers group equipment.
Metrics:
I am using collectd, Carbon, Grafana cloud for metrics. i.e all the servers have collectd, collectd ingests metrics into Carbon, Carbon forwards these metrics into Grafana cloud. Based upon patterns, set threshold alerts. I am planning to ingest custom additional metrics. But that’s planned for later. Definitely when I get to this phase, I would write some blog posts.
Alerts:
Considering the R&AW / Mafia / Anonymous hackers threat (capabilities of the equipment) – the most damage can happen if they login into AWS Console / SSH into servers. I have wrote some custom code for a lambda that would parse cloudwatch logs looking for AWS console login pattern and sends an alert. This Lambda runs once every minute. The anonymous hackers / spies / R&AW / Mafia might screenshot my AWS account or even record video or even might show my screen in a live video but they can’t login because of biometric MFA authentication.
Similarly I have configured my servers to send an email alert as soon as a SSH login happens. I access my Linux servers from within AWS website using EC2 Instance Connect rather than direct SSH. In other words, if anyone wants to access my Linux servers, they have to first login into AWS console using YubiKey Bio – in other words, no one else can login as of now.
I can provide code samples for the above 2 activities in a later blog post.
TimeSlices:
Earlier, I mentioned about a concept – TimeSlices. I don’t need all logs forever, if I want a certain logstream during a certain period, retain those logs.
Similarly another nice to have feature would be the ability to configure different retention periods for different types of logs. For example, remove traces after x day, remove debug after y days, remove info after z day. Retain Warn, Error, Critical for a longer period.
I am hoping this blog post helps someone. If anyone needs any help with architecting, planning, designing, developing for horizontal and vertical scalability or want any help with centralized logging or enterprise search using Solr or ElasticSearch or want to reduce costs by rightsizing, please do contact me. I offer free consultation and we can agree on the work that needs to be performed and the pricing.
EFS stands for Elastic File System. EFS is a network filesystem where data can persistent and can be accessed by several different EC2 instances.
In pursuit of having my own crash-resistant, tamper-proof, immutable logs and any other future sensitive information I wanted to leverage EFS in my startup ALight Technology And Services Limited.
This article does not discuss EFS in-depth i.e throughput types, Standard vs One Zone etc.. This article is simply about how to mount and automatically mount.
Create the EFS in the region where you need. My current datacenter is in London, United Kingdom because my company is registered in London, United Kingdom (Once again my sincere respect and gratitude for the Government of United Kingdom)
In your EC2 security groups allow port 2049, attach the EC2’s security groups in the networking section of the EFS.
We use cookies on our website to give you the most relevant experience by remembering your preferences and repeat visits. By clicking “Accept All”, you consent to the use of ALL the cookies. However, you may visit "Cookie Settings" to provide a controlled consent.
This website uses cookies to improve your experience while you navigate through the website. Out of these, the cookies that are categorized as necessary are stored on your browser as they are essential for the working of basic functionalities of the website. We also use third-party cookies that help us analyze and understand how you use this website. These cookies will be stored in your browser only with your consent. You also have the option to opt-out of these cookies. But opting out of some of these cookies may affect your browsing experience.
Necessary cookies are absolutely essential for the website to function properly. These cookies ensure basic functionalities and security features of the website, anonymously.
Cookie
Duration
Description
cookielawinfo-checkbox-advertisement
1 year
Set by the GDPR Cookie Consent plugin, this cookie is used to record the user consent for the cookies in the "Advertisement" category .
cookielawinfo-checkbox-analytics
11 months
This cookie is set by GDPR Cookie Consent plugin. The cookie is used to store the user consent for the cookies in the category "Analytics".
cookielawinfo-checkbox-functional
11 months
The cookie is set by GDPR cookie consent to record the user consent for the cookies in the category "Functional".
cookielawinfo-checkbox-necessary
11 months
This cookie is set by GDPR Cookie Consent plugin. The cookies is used to store the user consent for the cookies in the category "Necessary".
cookielawinfo-checkbox-others
11 months
This cookie is set by GDPR Cookie Consent plugin. The cookie is used to store the user consent for the cookies in the category "Other.
cookielawinfo-checkbox-performance
11 months
This cookie is set by GDPR Cookie Consent plugin. The cookie is used to store the user consent for the cookies in the category "Performance".
viewed_cookie_policy
11 months
The cookie is set by the GDPR Cookie Consent plugin and is used to store whether or not user has consented to the use of cookies. It does not store any personal data.
Functional cookies help to perform certain functionalities like sharing the content of the website on social media platforms, collect feedbacks, and other third-party features.
Performance cookies are used to understand and analyze the key performance indexes of the website which helps in delivering a better user experience for the visitors.
Analytical cookies are used to understand how visitors interact with the website. These cookies help provide information on metrics the number of visitors, bounce rate, traffic source, etc.
Advertisement cookies are used to provide visitors with relevant ads and marketing campaigns. These cookies track visitors across websites and collect information to provide customized ads.