
OpenTelemetry is pretty much like logs and metrics with distinguishable TraceId’s.
Yesterday and this morning I have experimented with OpenTelemetry in a sample ASP.Net MVC application.
The Primary components are:
- A host for Tempo – using Grafana hosted Tempo – https://www.grafana.com. Grafana has a very generous 100GB traces per month in the free tier.
- Grafana Agent – As of now, I have used Grafana Agent on Windows laptop, have not configured on Linux production servers yet. Grafana Agent can be downloaded from here. Click on the releases in the right side and choose the Operating System. Here is the link for v0.31.0.
- OpenTelemetry SDK for .Net
The OpenTelemetry SDK for .Net are in preview, the API’s might change.
Install the Grafana Agent and update the configuration file. Here is a sample of the config:
server:
  log_level: warn
metrics:
  wal_directory: C:\ProgramData\grafana-agent-wal
  global:
    scrape_interval: 1m
  configs:
    - name: integrations
integrations:
  windows_exporter:
    enabled: true
traces:
  configs:
  - name: default
    remote_write:
      - endpoint: tempo-us-central1.grafana.net:443
        basic_auth:
          username: <YOUR GRAFANA USER_ID>
          password: "<YOUR GRAFANA API KEY>"
    receivers:
      jaeger:
        protocols:
          grpc:
          thrift_binary:
          thrift_compact:
          thrift_http:
      zipkin:
      otlp:
        protocols:
          http:
          grpc:
      opencensus:
Restart the Grafana Service Services.
Add the following pre-release dll’s to your ASP.Net MVC application.
“OnLINE Erra, Thota terrorist bastards are spy bastards, they don’t command me, I do whatever I like, because they use invisible spying drone they try to frame me“
OpenTelemetry.Api
OpenTelemetry.Exporter.Jaeger
OpenTelemetry.Extensions.Hosting
OpenTelemetry.Instrumentation.AspNetCore
OpenTelemetry.Instrumentation.Http
Now use the following code:
builder.Services.AddOpenTelemetry()
        .WithTracing(builder => builder  .SetResourceBuilder(ResourceBuilder.CreateDefault().AddService("Sample-Web"))
            .AddAspNetCoreInstrumentation()
            .AddGrpcCoreInstrumentation()
            .SetErrorStatusOnException()
            .AddJaegerExporter()
            .AddConsoleExporter())
        .StartWithHost();
Run the application.
Now goto your Grafana account, click browse select the traces from the drop down in the top.
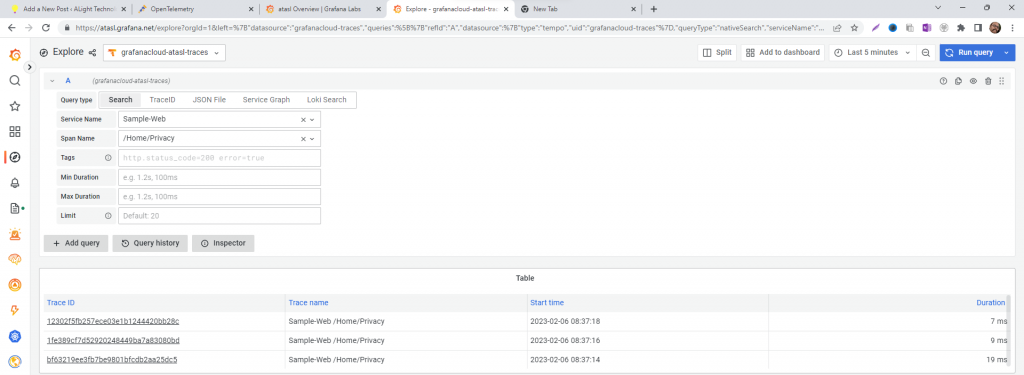
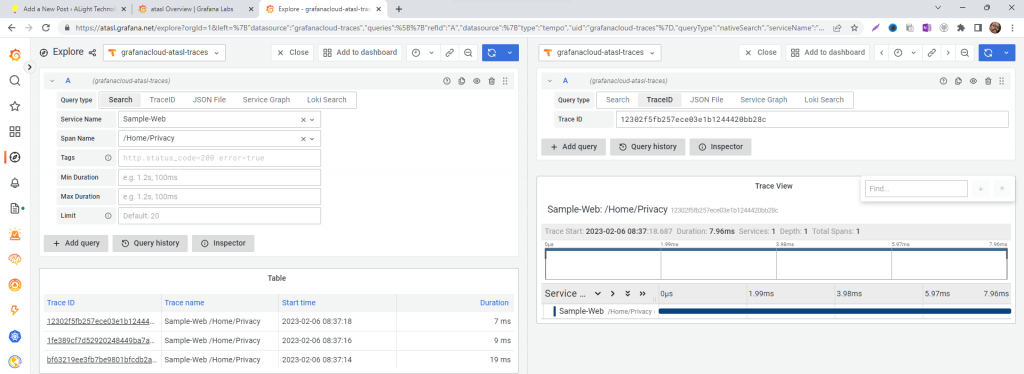
Clicking on one of the trace id shows the details:
There are additional Trace Collectors that can be used on a necessity basis for:
MySQL Client
SQL Server Client
HTTP Client
GRPC
ElasticSearch
AWS
AWS Lambda
You can expect to see some more blog articles regarding Loggin, Tracing and Metrics i.e Observability.
–
Mr. Kanti Kalyan Arumilli

B.Tech, M.B.A
Founder & CEO, Lead Full-Stack .Net developer
ALight Technology And Services Limited
Phone / SMS / WhatsApp on the following 3 numbers:
+91-789-362-6688, +1-480-347-6849, +44-07718-273-964
kantikalyan@gmail.com, kantikalyan@outlook.com, admin@alightservices.com, kantikalyan.arumilli@alightservices.com, KArumilli2020@student.hult.edu, KantiKArumilli@outlook.com and 3 more rarely used email addresses – hardly once or twice a year.